Concept
Absorption
Absorption is a Wyckoff concept. The Library holds 1 implementation, a working definition you can pull into Quant.
Top Absorption indicator
The top custom implementation, built on the original standard Absorption formula.
1 total
From studying Absorption to trading it: take the implementation below into Quant and backtest it instantly.
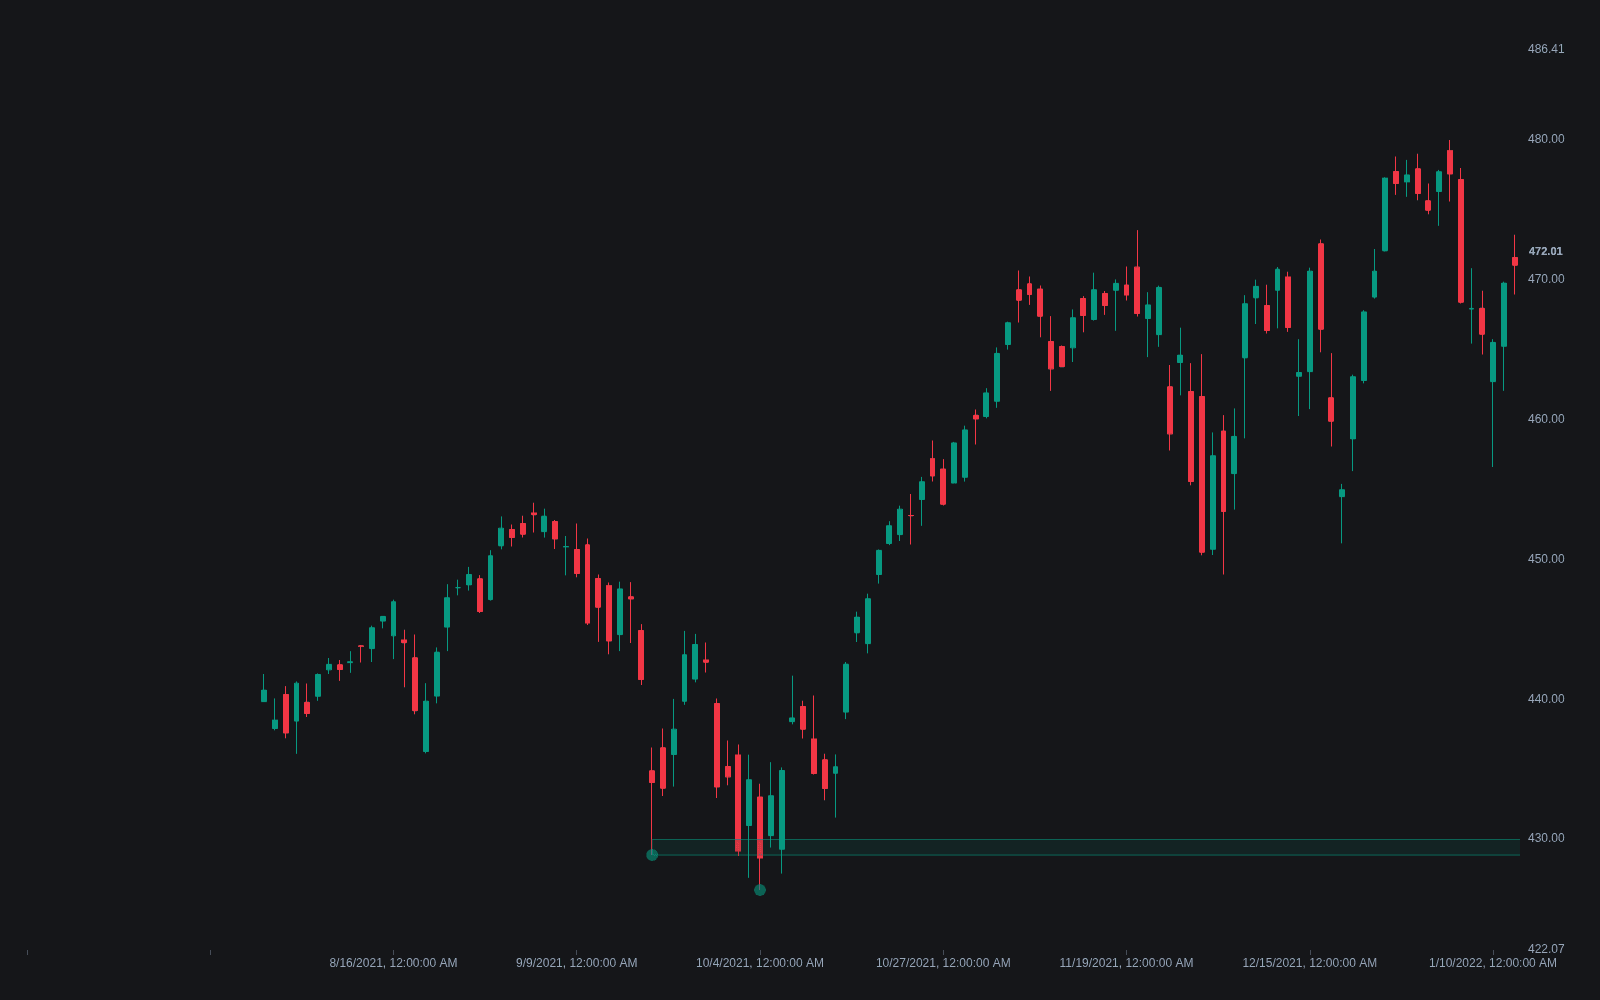
What is Absorption?
Absorption is what happens when aggressive orders pour into a price level and the level holds anyway: resting passive orders take everything thrown at them, so volume prints heavily while price makes little or no progress. It is effort vs result concentrated at a single level. In the Wyckoff Method, it is how large interests build or unload positions without moving the market against themselves: absorbing supply near the top of a base before markup, or absorbing demand under a top before markdown.
On a chart, absorption looks like repeated pushes into the same level on elevated volume that keep failing to break it, often with narrow-range bars or long wicks at the contact point. Order-flow tools make the mechanic explicit: volume delta or footprint views showing heavy aggressive volume with no price displacement. The read is confirmed only in hindsight: if the absorbing side has taken all it wants, price typically leaves the level quickly, and if the level instead breaks with follow-through, the aggressive side won.
The idea is over a century old: Richard Wyckoff described absorption in his early-1900s tape-reading work and built it into the trading-range logic of his later course, reasoning that large operators cannot buy meaningful size without either moving price or letting other people's selling come to them. In the Wyckoff accumulation schematic, the later phases show exactly this, remaining supply absorbed on tests before markup, and the Wyckoff distribution schematic mirrors the process at tops.
Absorption matters because it carries a causal story rather than a purely statistical one: heavy volume that cannot move price implies a resting counterparty with size and intent. That inference feeds the range's endgame, since a spring probing below well-absorbed support finds little real supply left, while an upthrust above absorbed resistance strands late buyers the same way; both events test how thorough the earlier absorption was.
How to identify absorption on a chart
Absorption is read from the relationship between volume, spread, and level behavior across several tests, not from a single bar.
- 1Locate a level tested repeatedly, ideally three or more times, where each approach attracts clearly elevated volume.
- 2Compare effort with result on the test bars: high volume with narrow spread, or a close well off the extreme, is the classic signature.
- 3Watch how the tests evolve: probes that reach less far into the level and get rejected faster suggest the aggressive side is weakening while the defense holds its ground.
- 4Check behavior between tests: in accumulation-style absorption, rallies off the level hold more of their ground while dips into it shrink.
- 5Demand the confirming departure: absorption is proven when price finally leaves the level with ease and refuted when the level breaks decisively.
How traders use it
- To grade level strength: when sellers repeatedly hit a support zone on heavy volume and it refuses to break, the failed effort marks the zone as actively defended rather than passively hoped for. Stopping volume at the lows is the classic Wyckoff example.
- Inside trading ranges: Wyckoff readings look for supply being absorbed in the later phases of accumulation, visible as rallies that hold more ground while dips shrink, as evidence the range is nearing resolution.
- As a trap warning: absorption of breakout buying just above a broken high, seen as heavy volume with no continuation, often precedes the failure of that breakout.
- As setup context for springs and upthrusts: either event carries more weight when the preceding tests showed genuine absorption, because the side that would fight the reversal has already spent its orders.
- In wave-by-wave volume work: Wyckoff wave and volume studies compare the volume and progress of successive buying and selling waves inside a range, quantifying whether one side's effort is being steadily soaked up.
Absorption vs related Wyckoff concepts
Effort vs Result: Effort vs result is the general law: volume is effort, price movement is result, and divergences between them demand explanation. Absorption is the specific case where that divergence concentrates at one defended level.
Spring: A spring is a discrete event, a brief break below range support that fails and reverses. Absorption is the extended process that often precedes it; the spring then tests whether any real supply remains beneath the level.
Upthrust: An upthrust is the bearish counterpart, a failed poke above range resistance. When the demand above a range has already been absorbed, the upthrust strands breakout buyers and often starts the markdown.
Concept family
Wyckoff
17 concepts mapped · 17 in the Library
Absorption FAQ
Turn Absorption into a trading strategy.
Take the implementation from this page into Quant, then build on it, backtest it on real data, and keep refining it in conversation.