Concept
Wyckoff Wave & Volume Studies
Wyckoff Wave & Volume Studies are Wyckoff concepts. The Library holds 1 implementation, a working definition you can pull into Quant.
Weis
Top Wyckoff Wave & Volume Studies indicator
The top custom implementation, built on the original standard Wyckoff Wave & Volume Studies formula.
1 total
Want to trade Wyckoff Wave & Volume Studies? The implementation below is one prompt away from a backtested strategy in Quant.
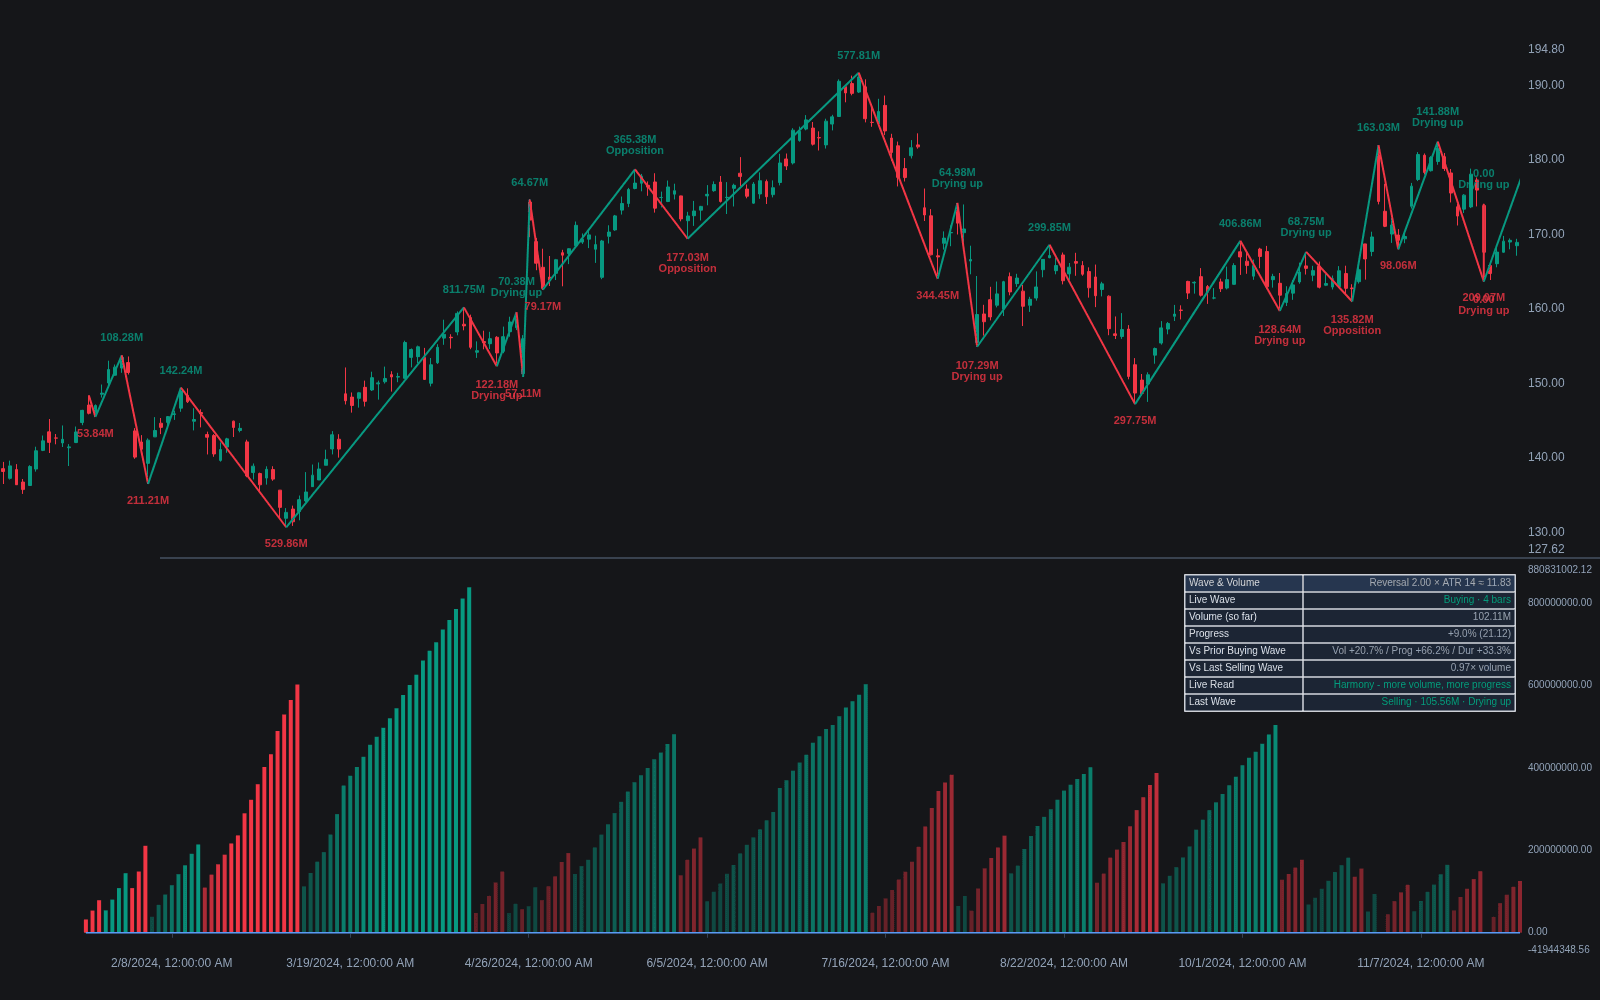
What are Wyckoff Wave & Volume Studies?
Wyckoff Wave & Volume Studies read the market as alternating buying and selling waves instead of fixed-time bars. Each swing's price progress, duration, and cumulative volume are measured and compared against previous waves in the same direction: how much effort each wave carried and how much ground it won. Wyckoff himself tape-read intraday waves and kept wave charts of a small basket of active leading stocks, and David Weis later formalized the volume side by accumulating volume across each swing, the method now known as Weis Wave Volume.
The wave chart is one of the oldest artifacts of the Wyckoff Method. Wyckoff plotted an intraday wave line built from a handful of leading stocks, judging the market's trend from the character of its buying and selling waves rather than from any single issue, and the Stock Market Institute maintained a Wyckoff Wave index in that tradition for decades after his death. The modern revival owes most to David Weis, a longtime Wyckoff practitioner and author of Trades About to Happen, whose wave-volume rendering was ported to retail charting platforms and is now the form most traders meet first.
The underlying logic is effort vs result at swing scale. Growing wave volume with shrinking progress warns that a trend is meeting opposition; shrinking volume on pullback waves suggests the opposing side is drying up. Because waves are built from a swing definition, usually a zigzag-style reversal threshold, the chosen threshold changes what counts as a wave, so comparisons are only meaningful under consistent settings.
The wave lens matters because fixed-time bars fragment exactly the information Wyckoff cared about. A three-day decline and a five-day rally are hard to compare bar by bar, but as two waves each becomes a single unit of effort and result. That is how practitioners grade the tests, springs, and upthrusts that punctuate the Wyckoff Accumulation Schematic and Wyckoff Distribution Schematic. Wave totals also make absorption visible: enormous volume in a wave that covers little ground is the classic signature of one side swallowing everything the other offers.
How to read wave and volume studies on a chart
Wave tools redraw activity swing by swing, so setup and consistency matter more than any single reading.
- 1Apply a wave-volume indicator (Weis Wave implementations are the most common) and set the swing reversal threshold for your timeframe; each rendered column should correspond to one visible swing.
- 2Check the fit: if columns flip on every minor wiggle the threshold is too small, and if whole trend legs merge into one wave it is too large.
- 3Compare successive waves in the same direction on three dimensions: cumulative volume, price progress, and duration.
- 4Flag divergences: a wave with more volume but less progress than its predecessor signals opposition, while pullback waves shrinking in volume signal the counter-side drying up.
- 5Anchor conclusions to structure: read wave evidence at range boundaries, tests, and breakouts, where the question the wave answers is clearest.
How traders use it
- To judge trend health by comparing successive waves in the trend direction: later waves that need more volume to cover less ground hint at exhaustion or absorption, while waves that travel farther on similar effort argue the trend is still efficient.
- To grade tests inside trading ranges: a retest of the lows on a small selling wave, with little volume and little progress, supports an accumulation read, while heavy selling waves that keep reaching lower argue for breakdown.
- To validate springs and upthrusts: an undercut on a small, low-volume selling wave that recovers argues exhaustion, while a heavy wave that keeps sinking argues genuine supply.
- To judge breakouts: a move through range resistance riding a buying wave that dwarfs recent selling waves supports the breakout, while a breakout on an unremarkable wave invites the failure read.
- To keep comparisons honest: wave studies depend on the swing threshold, so practitioners fix the reversal size per timeframe and compare like with like rather than mixing settings.
- As a modern stand-in for tape reading: cumulative wave volume compresses the intraday tape into comparable units, close in spirit to how Wyckoff originally tracked the market.
Wave & volume studies vs. related Wyckoff tools
Effort vs Result: The same law at different scales: effort versus result grades individual bars by spread against volume, while wave studies aggregate the comparison across whole swings. Bar reads spot single events; wave reads judge campaigns.
Wyckoff Method: The parent discipline: the method supplies the laws and the schematics, and wave studies are its measuring instrument, turning the qualitative comparison of rallies and reactions into countable totals.
Absorption: A condition wave studies detect rather than a rival tool: absorption appears as heavy wave volume with little price progress at a boundary, the quantitative signature of one side being taken down quietly.
Concept family
Wyckoff
17 concepts mapped · 17 in the Library
Wyckoff Wave & Volume Studies FAQ
Turn Wyckoff Wave & Volume Studies into a trading strategy.
Take the implementation from this page into Quant, then build on it, backtest it on real data, and keep refining it in conversation.