Concept
Outlier Detection
Outlier Detection is a Statistics concept. The Library holds 1 implementation, a working definition you can pull into Quant.
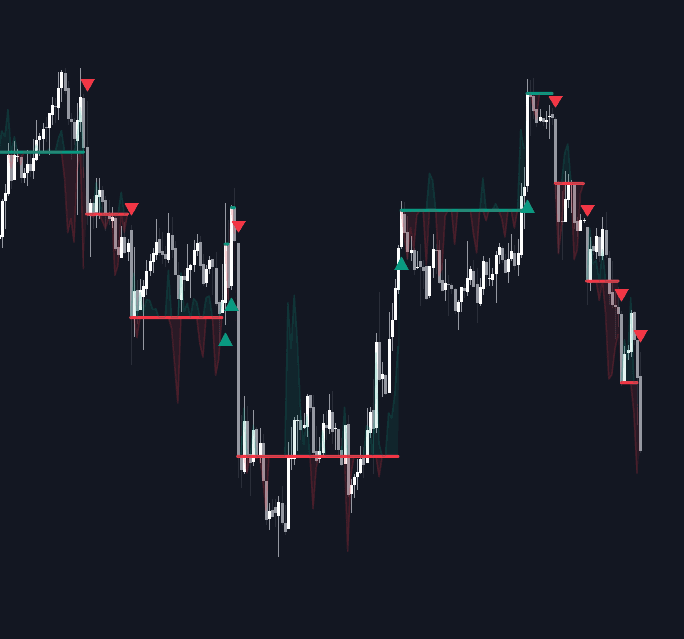
Top Outlier Detection indicator
The top custom implementation, built on the original standard Outlier Detection formula.
1 total
The Outlier Detection implementation below can become a backtested trading strategy — describe your rules and Quant writes the code.
What is Outlier Detection?
Outlier detection flags observations that sit far outside the typical run of a series: a return, a volume print, or an indicator value that does not belong to the recent distribution. The standard tools are threshold rules. A z-score beyond a chosen multiple of standard deviations is the textbook version; robust variants use the median and MAD (median absolute deviation) so the outliers being hunted have little pull on the yardstick; interquartile fences and percentile cutoffs avoid normality assumptions; and sequential methods such as CUSUM catch shifts that accumulate rather than spike.
The toolkit predates markets by more than a century. Benjamin Peirce proposed a rejection criterion for doubtful astronomical observations in 1852, Frank Grubbs published his significance test for a single outlier in 1950, and John Tukey's 1977 Exploratory Data Analysis introduced the fences at 1.5 times the interquartile range that box plots still use. The sequential branch began with E. S. Page's 1954 CUSUM procedure for industrial quality control, where the question is not whether one reading is extreme but whether the process has quietly shifted. Trading inherited these methods largely intact; only the data changed.
Markets complicate the textbook because returns are heavy-tailed: extreme prints occur far more often than a normal distribution implies, so a fixed three-sigma rule over-fires in volatile regimes and under-fires in quiet ones. Distribution-of-returns profiling makes that failure measurable: once the tails are documented, thresholds can be set from the series' own percentiles rather than Gaussian tables. Purpose also splits in two. One use is hygiene, catching bad ticks before they poison indicators; the other treats the outlier as the signal, since an abnormal volume spike or return jump is often exactly the event a strategy wants to react to.
The detail that decides whether a detector works is the robustness of its yardstick. A large outlier inflates the very standard deviation used to judge it, an effect called masking, which is how one extreme print hides another; median-and-MAD scoring largely escapes this because the median barely moves when a single value explodes. The stakes extend downstream. Least-squares tools such as linear regression and polynomial regression weight errors quadratically, so one wild point can tilt an entire fit, and a correlation estimate can be manufactured or destroyed by a single shared spike. Screening inputs is part of building almost any statistical indicator, not a separate chore.
How to spot outliers on a chart
Outlier work is done on a derived series rather than raw price. A practical scan looks like this:
- 1Pick the series to police: bar returns, volume, or an indicator value. Raw price is unsuitable because trending data makes every new high look extreme.
- 2Build a rolling baseline and dispersion measure over a fixed window, either mean and standard deviation or, more robustly, median and MAD.
- 3Standardize each new observation against that baseline and mark bars whose score passes the threshold, commonly somewhere between 2.5 and 4 depending on the series' tail weight.
- 4Separate errors from events: a flagged print that reverses instantly with no catalyst looks like a bad tick, while one that arrives with news and holds is information.
- 5Re-tune by regime: what is extreme in a quiet market is routine in a volatile one, so judge scores against the current window rather than an all-time yardstick.
How traders use it
- As data hygiene: filtering or winsorizing bad prints before computing averages and volatility estimates, since a single spike can distort every downstream indicator for its full lookback.
- As event detection: returns or volume far outside the recent distribution serve as triggers for breakout, reversal, or news-driven logic.
- As robust engineering: median-based filters and clipped inputs let indicators tolerate outliers instead of requiring their removal.
- As regime monitoring: a burst of same-direction flags is escalated as a possible structural break rather than filtered away, the point where single-bar detection hands off to CUSUM-style accumulation tests.
- As a character check on the series itself: flag rates are read alongside autocorrelation and entropy measures to judge whether a market has genuinely changed behavior or merely printed one rogue bar.
Outlier Detection vs related statistics
Z-score: The z-score is the measuring stick and outlier detection the decision built on it: choose the baseline, choose the threshold, decide what happens to flagged points. A z-score by itself flags nothing.
Percentile Rank: Percentile rank grades every observation within its window without assuming any distribution. Detection draws a line and acts only beyond it; percentile cutoffs make sturdy outlier rules for heavy-tailed series where sigma multiples mislead.
Distribution-of-returns Profiling: Profiling describes the whole shape of a series, tails and skew included, while detection makes bar-by-bar calls. The profile calibrates the threshold; the detector enforces it.
Concept family
Statistics
46 concepts mapped · 46 in the Library
Outlier Detection FAQ
Turn Outlier Detection into a trading strategy.
Take the implementation from this page into Quant, then build on it, backtest it on real data, and keep refining it in conversation.