Matrix Profile
 By LuxAlgoApr 28, 2026
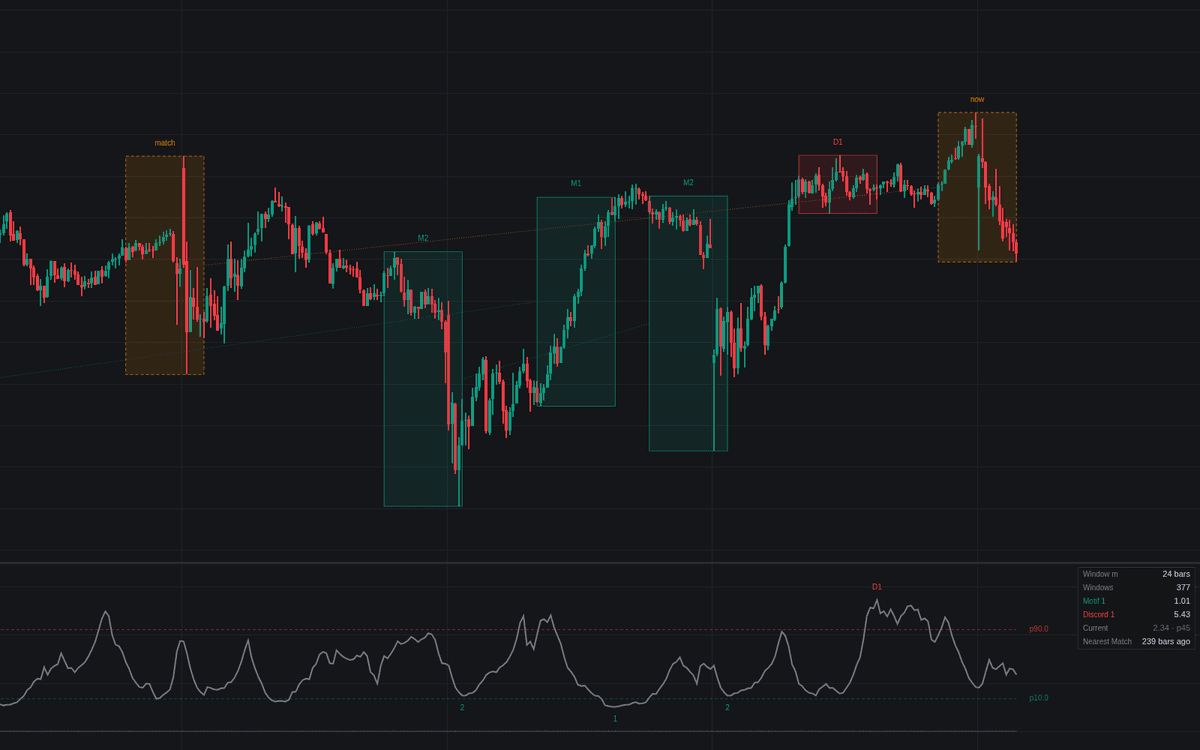

Matrix Profile brings genuine all-pairs shape search to the chart, the first faithful implementation of the matrix profile in the library. Every 24-bar window of the last 400 bars is compared against every other, and each window's z-normalized distance to its nearest neighbor draws as a companion series: valleys are shapes that recurred, peaks are stretches unlike anything else in the sample, zero an exact repeat.
How to Trade the Matrix Profile?
- Motifs (M1, M2): the lowest profile points extract as window pairs, boxed on the price chart: evidence a shape repeated, never that it predicts.
- Discords (D1): the highest points mark windows with no good match anywhere, anomalies worth review as regime breaks, data errors or event reactions.
- Current window match: the newest window and its nearest historical neighbor are outlined together, an analog pre-filter to re-rank with the finer machine learning tools.
Matrix Profile Settings
- Source (default close) and Use First Differences (off): the series analyzed; differences match movement shape, not level path.
- Window Length (m) (default 24): the scale of the shapes the profile can find.
- Analysis Bars (n) (default 400): the sample the self-join scans.
- Exclusion Zone (x m) (default 0.5): half-width of the skip zone suppressing trivial self-matches.
- Motif Pairs (default 2) and Discords (default 1): extremes to extract, spaced an exclusion zone apart.
- Motif Percentile (default 10.0) and Discord Percentile (default 90.0): the dashed guide levels and alert thresholds for the newest window.
- Display: Current Window Match, Mark Motifs & Discords On Chart, Percentile Guides and Show Dashboard (all on), Profile Width (default 2).
Frequently Asked Questions

Original indicatorBuilt in-house by LuxAlgo
The Library is free. Quant makes it yours.
Pull any concept or indicator into Quant: rebuild it, retune it, or turn it into a backtested strategy of your own.