Bessel Filter
 By LuxAlgoJun 8, 2026
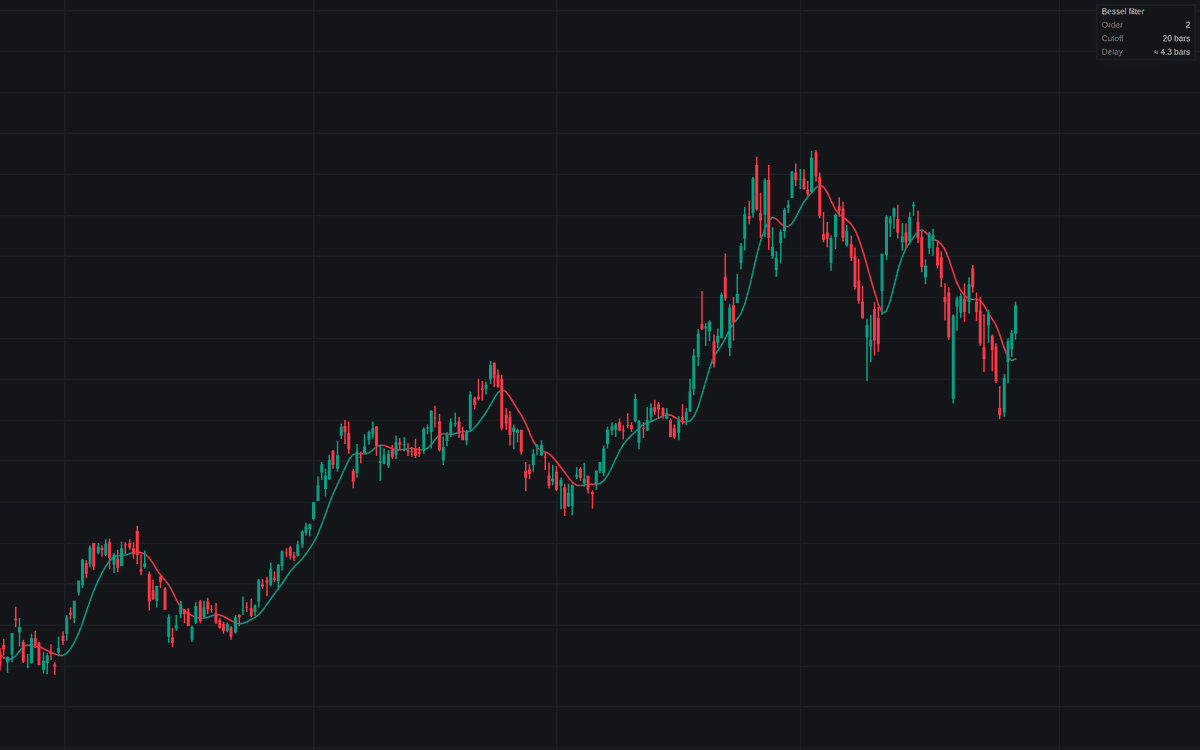

Bessel Filter brings the Bessel filter to price charts as the first purpose-built implementation of the design in the library: a low-pass smoother whose defining property (very nearly the same delay for every passed frequency) keeps the shape of the smoothed move intact instead of smearing it. The line is computed from the delay-normalized second- and fourth-order analog prototypes via the bilinear transform, pre-warped so the −3 dB point lands exactly on the requested cutoff period. The Bessel Filter plot colors by slope by default; an optional Fast Bessel Filter line supports crossover logic, and a dashboard reports order, cutoff, and the nominal passband delay in bars.
How to Trade the Bessel Filter?
- Slope color flip: the filter turning up or down marks a smoothed turning point, with matching Turned Up / Turned Down alerts.
- Price crossing the filter: classic moving-average-style cross rules, alertable in both directions; optional triangles mark the crossings.
- Fast line crossing the slow line: enable Show Fast Line for a two-line crossover system in which the main filter acts as the slow line.
The dashboard's delay row states roughly how many bars the line trails price, useful for judging how late any crossing will arrive.
Bessel Filter Settings
- Source (default close): series the filter smooths.
- Cutoff Period (default 20): approximate −3 dB cutoff wavelength in bars; slower swings pass, faster fluctuations are attenuated.
- Order (default 2): four poles sharpen the rolloff but add delay, running as two cascaded second-order sections.
- Show Fast Line (default disabled) with Fast Cutoff Period (default 10): the shorter-cutoff companion line.
- Show Dashboard (default enabled) plus its Location and Size.
- Line Coloring (default Directional) and Crossing Markers (default disabled) round out the style options.
Frequently Asked Questions

The Library is free. Quant makes it yours.
Pull any concept or indicator into Quant: rebuild it, retune it, or turn it into a backtested strategy of your own.