Cointegration
 By LuxAlgoApr 21, 2026
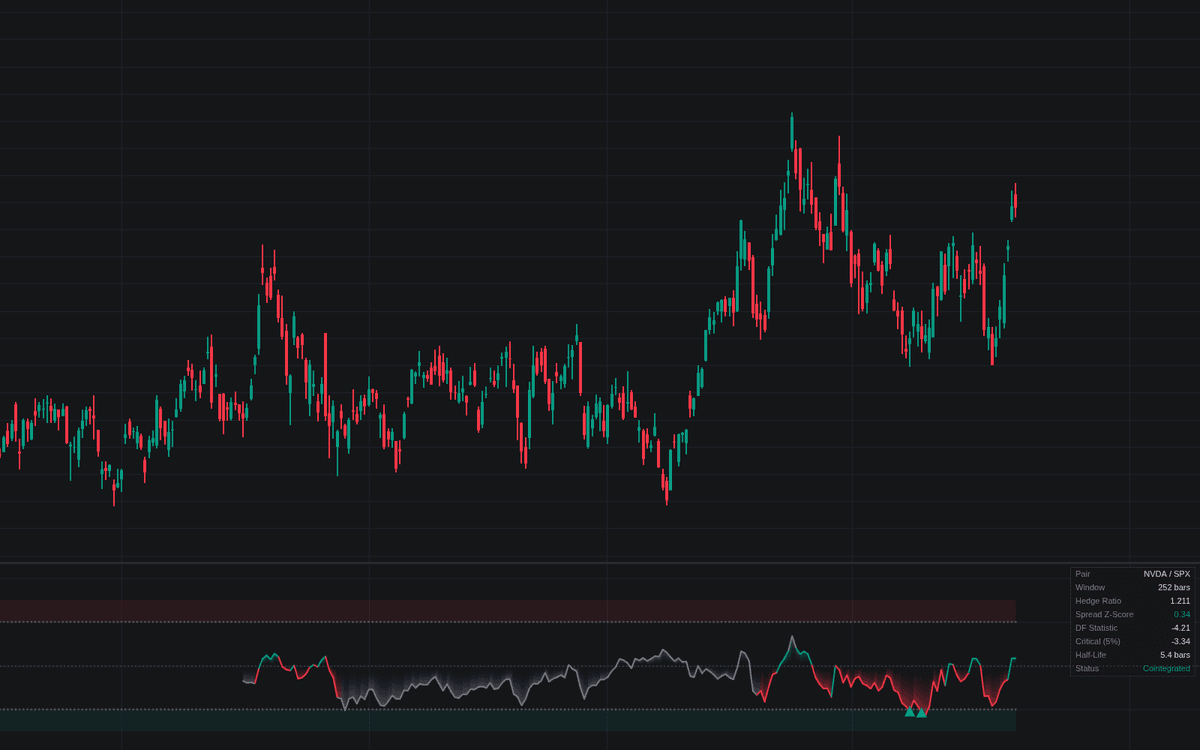

Cointegration is a pairs-testing workstation in one pane, the definitive clean implementation of cointegration for chart use. Every bar it regresses 252 bars of the chart symbol's log prices on a comparison leg (default SP:SPX) for a hedge ratio, rebuilds the residual spread, z-scores it, and runs the Engle-Granger step: the spread's Dickey-Fuller statistic must beat the MacKinnon critical value to test cointegrated. A dashboard reports hedge ratio, z-score, statistic, half-life and status.
How to Trade the Cointegration?
- Z-score beyond the entry levels: a cross above +2 is a short-spread event, below -2 a long-spread event, by default only while the pair tests cointegrated.
- Return to the mean: exit events fire when the z-score crosses the exit threshold back toward zero.
- Cointegration Established / Lost: transitions carry alerts; a lost relationship stands entries down: a broken pair's deviations have no reason to revert.
Cointegration Settings
- Comparison Symbol (default SP:SPX): second leg of the pair.
- Source (default close): price series for both legs.
- Use Log Prices (default on): regression and spread on log levels.
- Formation Window (default 252): bars behind regression, test and z-score.
- Significance Level (default 5%): test strictness; critical values -3.90 / -3.34 / -3.04.
- Plot Test Statistic (default off): plots the rolling statistic and its critical value.
- Entry Threshold (default 2): z-score arming entry events.
- Exit Threshold (default 0): reversion exit level; 0 waits for the full return.
- Signals Require Cointegration (default on): gate entries on a passing test.
- Show Signal Markers (default off): triangles on entries; alerts fire regardless.
- Show Dashboard (default on), with position and size options.
- Style inputs set the colors and the dimming of the spread while the pair fails the test.
Frequently Asked Questions

Original indicatorBuilt in-house by LuxAlgo
The Library is free. Quant makes it yours.
Pull any concept or indicator into Quant: rebuild it, retune it, or turn it into a backtested strategy of your own.