Concept
Cointegration
Cointegration is a Statistics concept. The Library holds 1 implementation, a working definition you can pull into Quant.
Engle-Granger. Johansen
Top Cointegration indicator
The top custom implementation, built on the original standard Cointegration formula.
1 total
The Cointegration implementation below can become a backtested trading strategy — describe your rules and Quant writes the code.
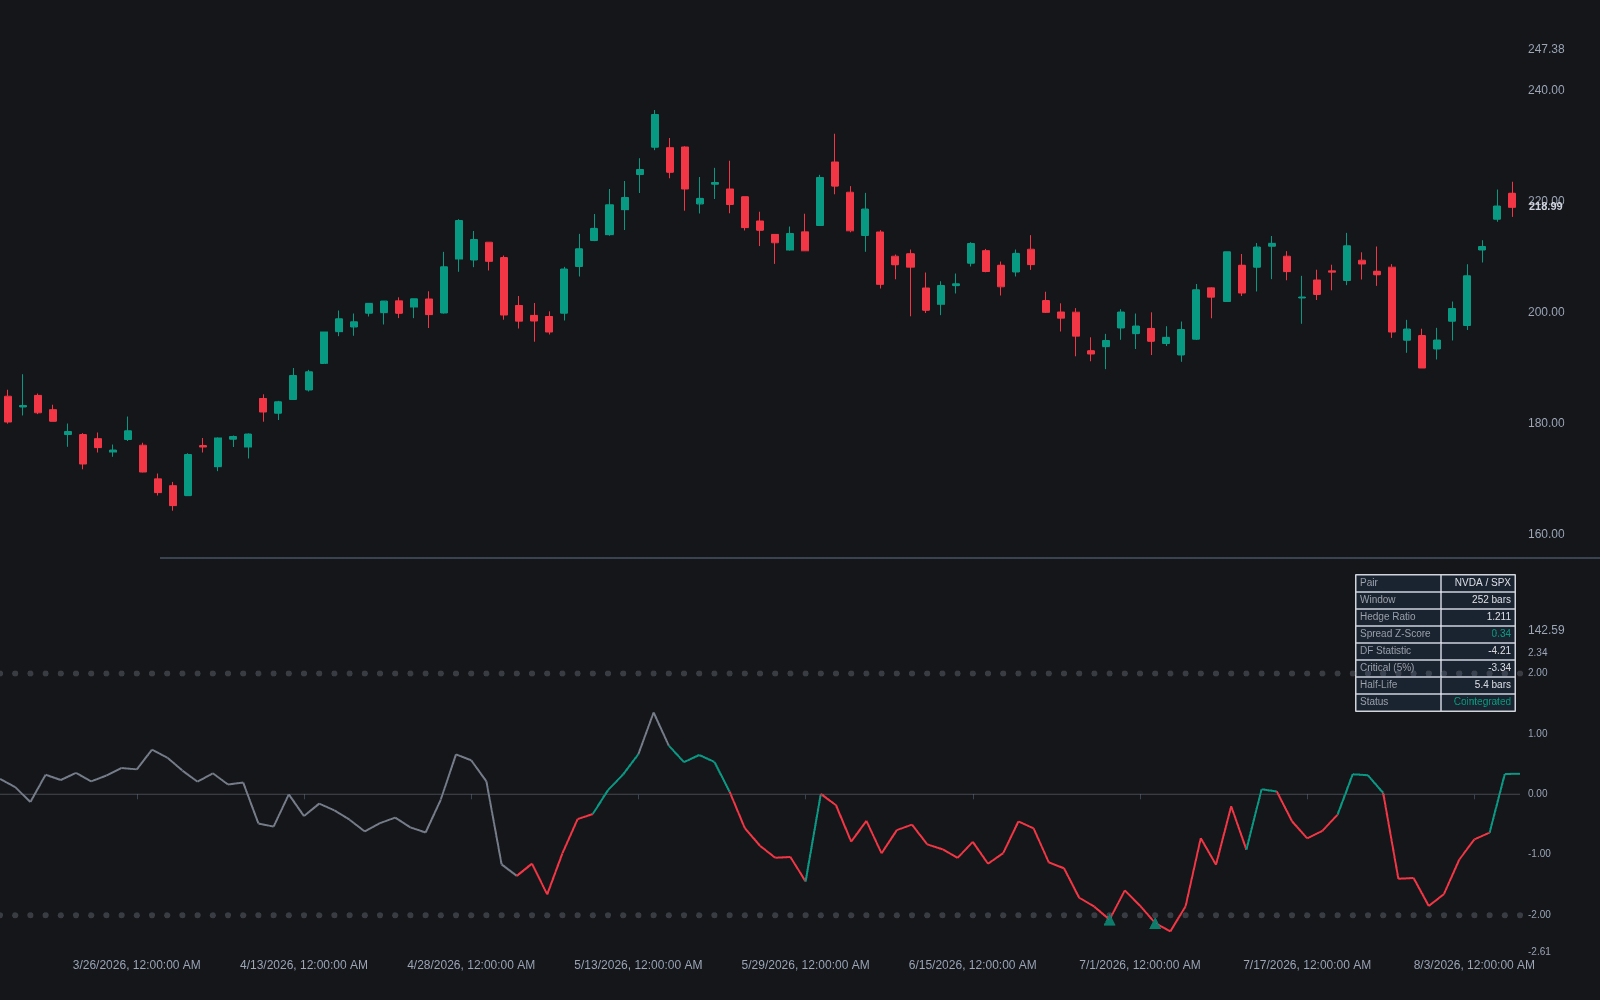
What is Cointegration?
Cointegration is a long-run statistical tether between price series. Two or more series that each wander without a fixed mean are cointegrated when some linear combination of them is stationary: the weighted spread oscillates around a stable level even though the individual legs drift freely. The idea was formalized by Engle and Granger (1987). The Engle-Granger procedure tests it by regressing one leg on the other and checking the residual for stationarity; the Johansen test generalizes to several series at once and counts how many independent cointegrating relationships exist. It is distinct from correlation, which measures whether returns move together bar to bar, not whether levels stay anchored over months.
The concept reshaped econometrics enough to earn Engle and Granger the 2003 Nobel memorial prize: it legitimized working with trending series by asking whether combinations of them, rather than the series themselves, behave. Trading adopted it as the statistical backbone of relative-value work, with the Johansen framework extending the idea from pairs to baskets, where several assets share common drivers and multiple stable spreads can coexist.
The concept matters because it is the statistical justification for spread and pairs trading: if the spread is stationary, deviations from its mean are expected, though never guaranteed, to be corrected, so the spread can be normalized (commonly z-scored) and faded at extremes with a hedge ratio taken from the cointegrating regression. The standing caveat is fragility: a relationship estimated in one window can weaken or break when fundamentals change, and a spread can keep widening far longer than a backtest suggests.
Practice adds two disciplines the textbook omits. Reversion speed matters as much as reversion existence, so desks estimate the spread's half-life (how many bars a deviation typically takes to decay halfway) and skip pairs that revert too slowly to trade; and search intensity poisons naive screens, since testing thousands of pairs at conventional thresholds manufactures dozens of spurious 'relationships' by chance alone, which out-of-sample verification and economic-linkage requirements exist to filter.
How to test for cointegration
The workflow runs from economic candidates to statistical verification to tradability checks.
- 1Start with economically linked candidates (shared sector, index, or input costs); statistical screens without a linkage story breed false positives.
- 2Estimate the hedge ratio by regressing one leg's levels on the other's over the formation window.
- 3Test the residual spread for stationarity (the Engle-Granger step); for baskets, use the Johansen procedure, which also yields the weights.
- 4Normalize the spread as a z-score of its own history so entry and exit thresholds are comparable across pairs.
- 5Estimate the half-life of reversion from the spread's own decay; too slow means untradable regardless of statistical significance.
- 6Re-test on rolling windows and monitor the spread's autocorrelation structure: a relationship is a hypothesis under continuous review, not a certificate.
How it's calculated
Tests whether two non-stationary price series share a stationary linear combination, the mean reverting spread that pairs trading exploits.
This is the Engle-Granger two step method; the Johansen test is the multivariate alternative and estimates the relationship differently.
Both series should individually be integrated of order one, meaning stationary after one differencing, before the test is meaningful.
Because β is estimated rather than known, the ADF statistic must be compared against the stricter Engle-Granger critical values.
How traders use it
- Pairs selection and sizing: screen related instruments for cointegration, take the hedge ratio from the regression, and trade z-score extremes of the spread back toward its mean, the core of a pairs trading stack.
- Relationship monitoring: re-test the spread on rolling windows so positions are only taken while the equilibrium still appears intact, and stand down when the residual stops testing stationary.
- Hedging: constructing offsetting positions whose combined value tracks the stationary combination, reducing exposure to the common drift the legs share.
- Holding-period design: the spread's estimated half-life sets expected trade duration and time-stops, so positions are exited when reversion is overdue rather than held on faith.
- Basket construction: Johansen weights define multi-asset spreads (one index against its components, related commodities against each other) that isolate a stationary relationship no single pair offers.
Cointegration vs related concepts
Correlation: Correlation measures whether returns move together over short horizons. Cointegration is about price levels sharing a long-run equilibrium: assets can be strongly correlated yet drift apart permanently, or weakly correlated yet tethered over long horizons. Spread trading rests on the tether, not the day-to-day echo.
Stationarity & Efficiency Tests: Stationarity tests interrogate a single series; cointegration asks whether a combination of non-stationary series becomes stationary. The Engle-Granger procedure literally ends in a stationarity test on the regression residual, which is why the two topics travel together.
Autocorrelation: Autocorrelation describes a single series' memory at fixed lags; a cointegrated spread is interesting precisely because its autocorrelation structure implies decay toward a mean. Half-life estimation is autocorrelation analysis applied to the spread the cointegration test certified.
Concept family
Statistics
46 concepts mapped · 46 in the Library
Cointegration FAQ
Turn Cointegration into a trading strategy.
Take the implementation from this page into Quant, then build on it, backtest it on real data, and keep refining it in conversation.