Concept
Dow Theory
Dow Theory, also known as primary/secondary/minor trends, accumulation–markup–distribution–markdown phases, index confirmation, volume confirms trend, is a Market Structure concept. The Library holds 1 implementation, a working definition you can pull into Quant.
Top Dow Theory indicator
The top custom implementation, built on the original standard Dow Theory formula.
1 total
Want to trade Dow Theory? The implementation below is one prompt away from a backtested strategy in Quant.
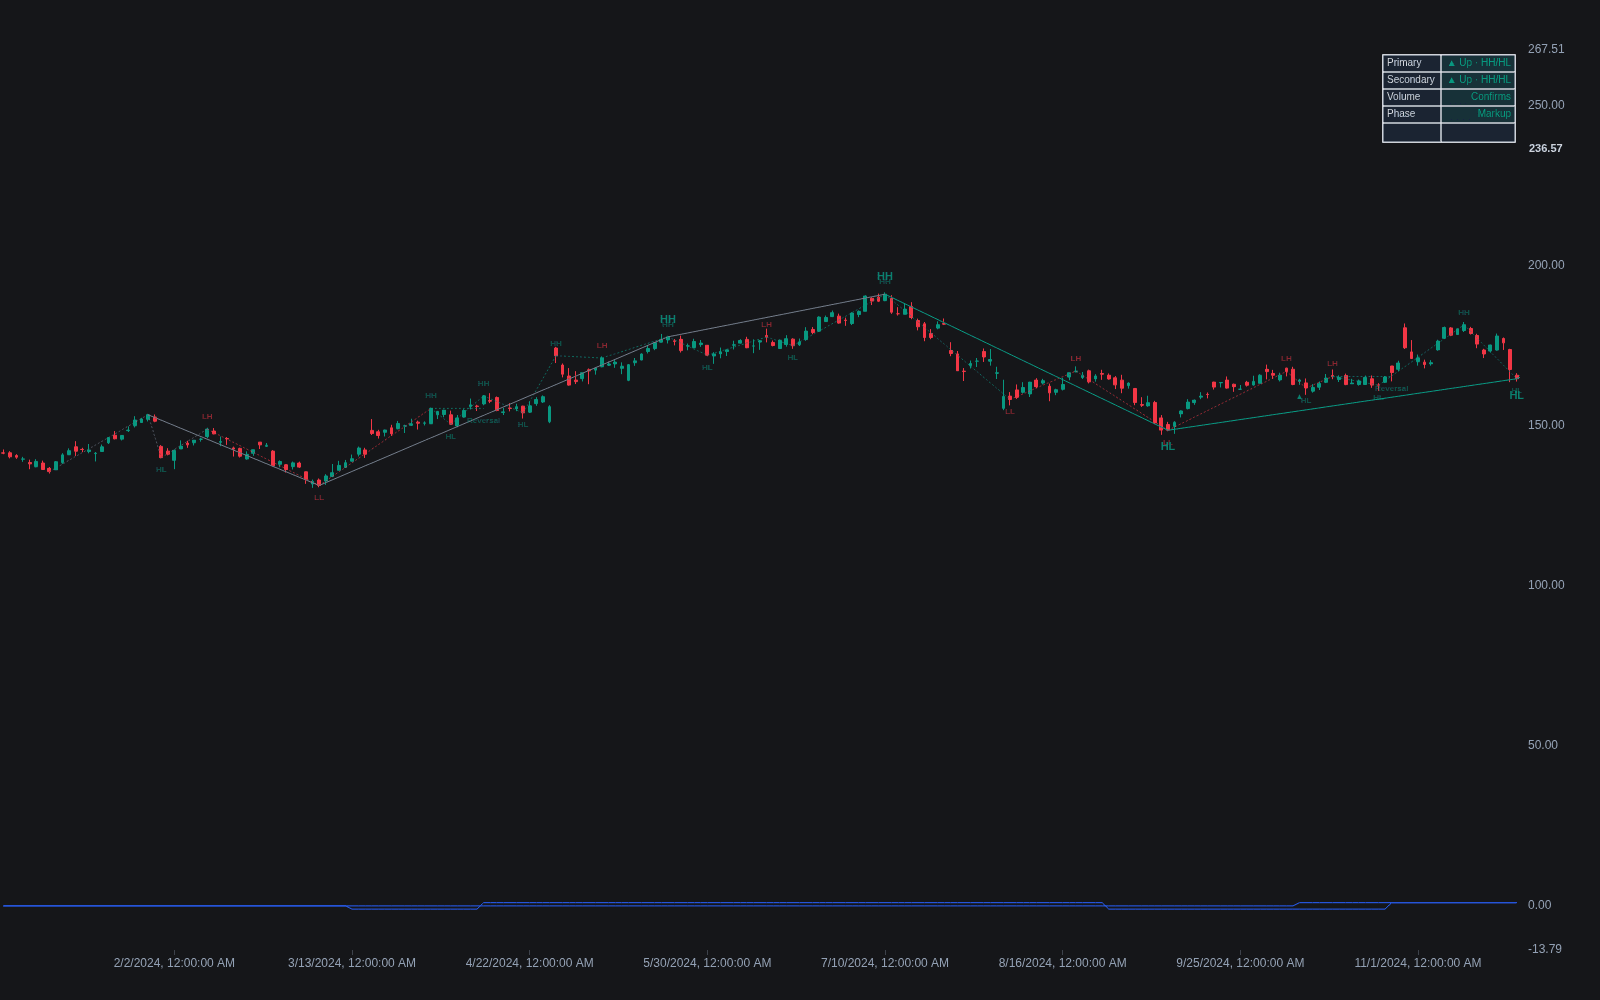
What is Dow Theory?
Dow Theory is widely regarded as the oldest codified branch of Western technical analysis: a set of principles describing how market trends form, persist, and reverse. It grew out of editorials that Charles H. Dow, co-founder of Dow Jones & Company and first editor of The Wall Street Journal, wrote between the late 1890s and his death in 1902. Dow himself never assembled the ideas into a system. The name came from S. A. Nelson's The ABC of Stock Speculation (1902), which compiled Dow's editorials after Nelson failed to persuade Dow to write a book, and the theory was given formal shape by Dow's successors: William Peter Hamilton in The Stock Market Barometer (1922) and Robert Rhea in The Dow Theory (1932).
Rhea's codification is usually summarized as six tenets. The averages discount everything knowable. The market moves in three trends at once: a primary trend lasting from under a year to several years, secondary reactions lasting weeks to months that retrace part of the primary move, and minor day-to-day fluctuations. Primary trends unfold in three phases, described as accumulation by informed buyers, public participation, and distribution; modern traders often recast this as the four-stage accumulation, markup, distribution, markdown cycle. The Industrial and Railroad averages must confirm each other, a rule now called index confirmation. Volume should expand in the direction of the trend. And a trend is presumed to continue until it gives definite signals of reversal.
The theory's most durable contribution is its structural definition of trend, judged on closing prices: an uptrend is a sequence of higher highs and higher lows, a downtrend the mirror image. That definition is the direct ancestor of today's swing structure grammar, in which traders label pivots HH, HL, LH, and LL and track when the sequence breaks. Much of modern market-structure trading, from classical trend following to Smart Money Concepts, is a refinement of this century-old rule set.
Its limits deserve equal billing. Dow Theory signals are deliberately late, since confirmation requires a completed swing. Classifying a move as secondary versus primary is subjective in real time, and the original index-confirmation rule, written for a rail-and-factory economy, translates awkwardly to modern markets. Its forecasting record is contested too: Alfred Cowles's 1933 study concluded that Hamilton's published calls lagged buy-and-hold, while a 1998 reappraisal by Brown, Goetzmann, and Kumar found the record held up better once risk was accounted for. Treat it as a framework for reading trend, not a mechanical system.
How to identify Dow Theory trends on a chart
Dow Theory analysis can be applied to any liquid market, but it was written for the daily closes of broad stock averages. Start on the daily or weekly chart, judge everything by closing prices rather than intraday wicks, and build the read from swing points outward.
- 1Mark the meaningful swing highs and lows on a daily or weekly chart. These pivots are the raw material of the whole method; everything else is read from their sequence.
- 2Read the sequence to define the trend: rising swing highs and rising swing lows mean an uptrend, falling ones a downtrend. Grade each move by degree, separating primary legs from secondary reactions and minor noise, the same discipline behind internal vs external structure.
- 3Check volume for confirmation. In a healthy uptrend, volume tends to expand on advances and contract on pullbacks; comparing the character of impulsive and corrective legs is the logic behind strong vs weak swings.
- 4Place the market in its phase: quiet basing after a long decline suggests accumulation, a broad and popular advance marks the markup or public-participation phase, and heavy churn near highs suggests distribution. Range behavior helps here; see accumulation vs distribution ranges.
- 5Treat sideways 'lines' with patience. Dow theorists waited for a narrow trading range to resolve with a decisive close beyond its boundary, precisely because a false breakout on the first poke through is common.
- 6Call a reversal only on structure failure: in an uptrend, a failure to print a new high followed by a close below the prior swing low. Modern traders label the same event a break of structure or change of character, but the test itself descends from Dow.
How traders use it
- As a trend filter: traders establish the primary trend on a higher timeframe and take trades only in that direction on lower ones, an approach formalized today as multi-timeframe structure alignment.
- As a reversal warning system: failure swings and closes beyond prior swing points flag that the primary trend is in question, prompting reduced size or tightened risk rather than precise counter-trend entries.
- For confirmation and breadth: the original rule compared the Industrial and Railroad averages, and traders adapt it by watching related indices, sectors, or correlated markets for non-confirmation before trusting a new high or low.
- For phase mapping: judging whether price sits in accumulation, markup, distribution, or markdown sets expectations for how mature a trend is and how aggressively to trade it.
- Through automation: indicators in the LuxAlgo Library such as DOW Theory Price Action Multi-Time Frame by Mohit_Kakkar08, Dynamic Market Structure (MTF) - Dow Theory by Leree123, and Market Structure (Dow) by Joeywave369 detect swing points and label Dow-style trend states across timeframes automatically.
Dow Theory vs related frameworks
Swing Structure Grammar: Swing structure grammar is Dow's trend definition turned into notation: HH, HL, LH, and LL labels applied to pivots on any timeframe. Dow Theory supplies the surrounding doctrine (trend degrees, phases, volume, and index confirmation), while the grammar is the labeling system it left behind.
Change of Character: A change of character is the modern name for the moment Dow theorists watched for: the first structural evidence that the prevailing trend has failed. Dow Theory demands that signal on closing prices at primary degree; CHoCH is applied on any timeframe, including intraday.
Livermore Pivotal Point: Jesse Livermore, trading in the same era, focused on pivotal price points in individual stocks rather than broad averages. Dow Theory reads the whole market's trend and waits for confirmation between indices; Livermore's method times entries where a specific issue proves itself at a key level.
Concept family
Market Structure
31 concepts mapped · 31 in the Library
Dow Theory FAQ
Turn Dow Theory into a trading strategy.
Take the implementation from this page into Quant, then build on it, backtest it on real data, and keep refining it in conversation.