FRAMA
 By LuxAlgoJun 7, 2026
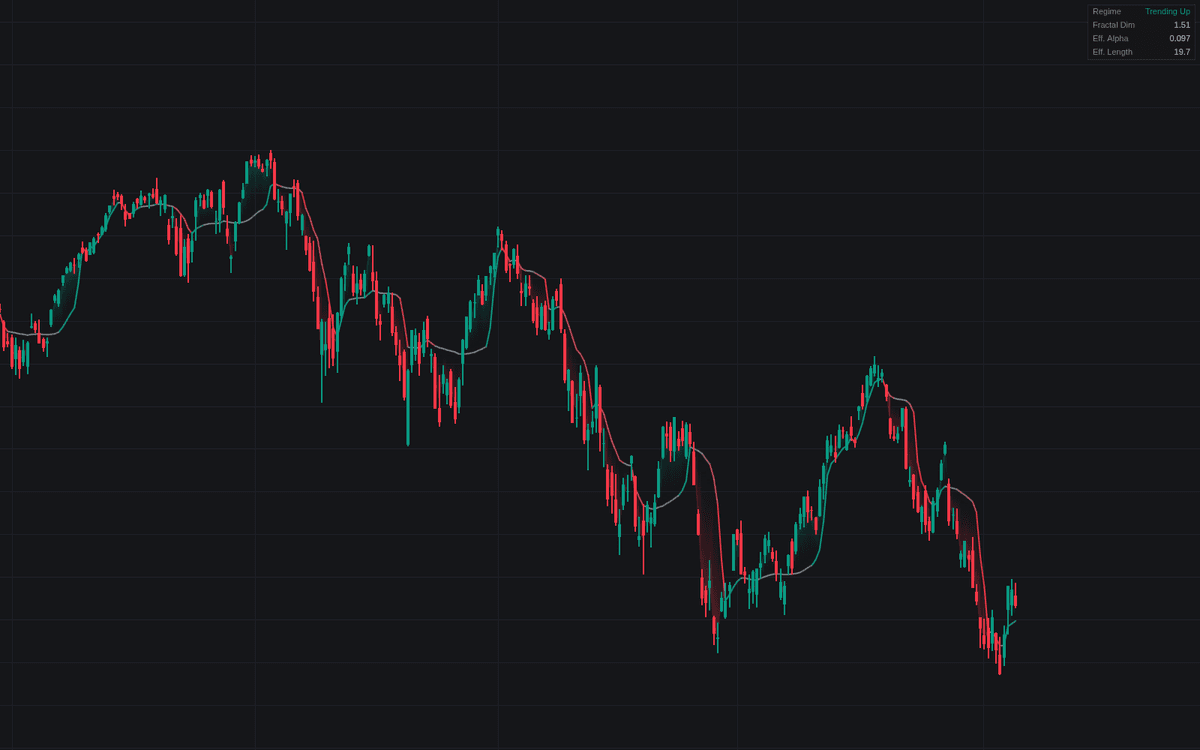

FRAMA plots John Ehlers' fractal adaptive moving average: an exponential smoother whose alpha is reset bar by bar by how rough (how fractal) the recent price path is, so one line acts slow in congestion and fast in trends. This build follows the published recipe of FRAMA (the dimension from a two-half box-counting comparison of highs and lows, alpha = exp(−4.6 × (D − 1)) clamped to 0.01–1) and adds an ATR-normalized slope read that splits the tape into bullish, bearish and flat phases.
How to Trade the FRAMA?
- Line color (with Trend Regime Coloring on): bullish above the Flat Threshold, bearish below its negative, flat in congestion. Each phase transition is alertable.
- Price crossings: closes through the line carry more weight when the fractal dimension is low; optional triangles and alerts cover both directions.
- Gradient intensity: with Adaptive Gradient on, the line pales as the dimension rises toward 2 (noise) and saturates toward 1 (clean trend).
FRAMA Settings
- Source (default hl2): the published filter smooths the bar midpoint; the dimension is always measured from highs and lows.
- Window Length (default 16): even lookback split into two halves for the dimension estimate; odd values round down. Longer windows steady the estimate but notice regime change later.
- Flat Threshold (default 0.05): one-bar slope, as a fraction of ATR, below which the line reads flat; raise it to demand steeper trends.
- ATR Normalization Length (default 14): ATR window that keeps the threshold consistent across symbols and timeframes.
- Show Dashboard (default enabled; Location Top Right, Size Small): regime, fractal dimension, effective alpha and its EMA-equivalent length.
- Style: Trend Regime Coloring (on), Adaptive Gradient (on), Price / FRAMA Gradient Fill (on), Price Crossing Markers (off), Line Width (2).
Frequently Asked Questions

Original indicatorBuilt in-house by LuxAlgo
The Library is free. Quant makes it yours.
Pull any concept or indicator into Quant: rebuild it, retune it, or turn it into a backtested strategy of your own.