Concept
FRAMA
FRAMA, also known as fractal adaptive MA, is a Trend concept. The Library holds 1 implementation, a working definition you can pull into Quant.
Top FRAMA indicator
The top custom implementation, built on the original standard FRAMA formula.
1 total
This FRAMA implementation is strategy-ready: open it in Quant, set your rules, and it backtests automatically.
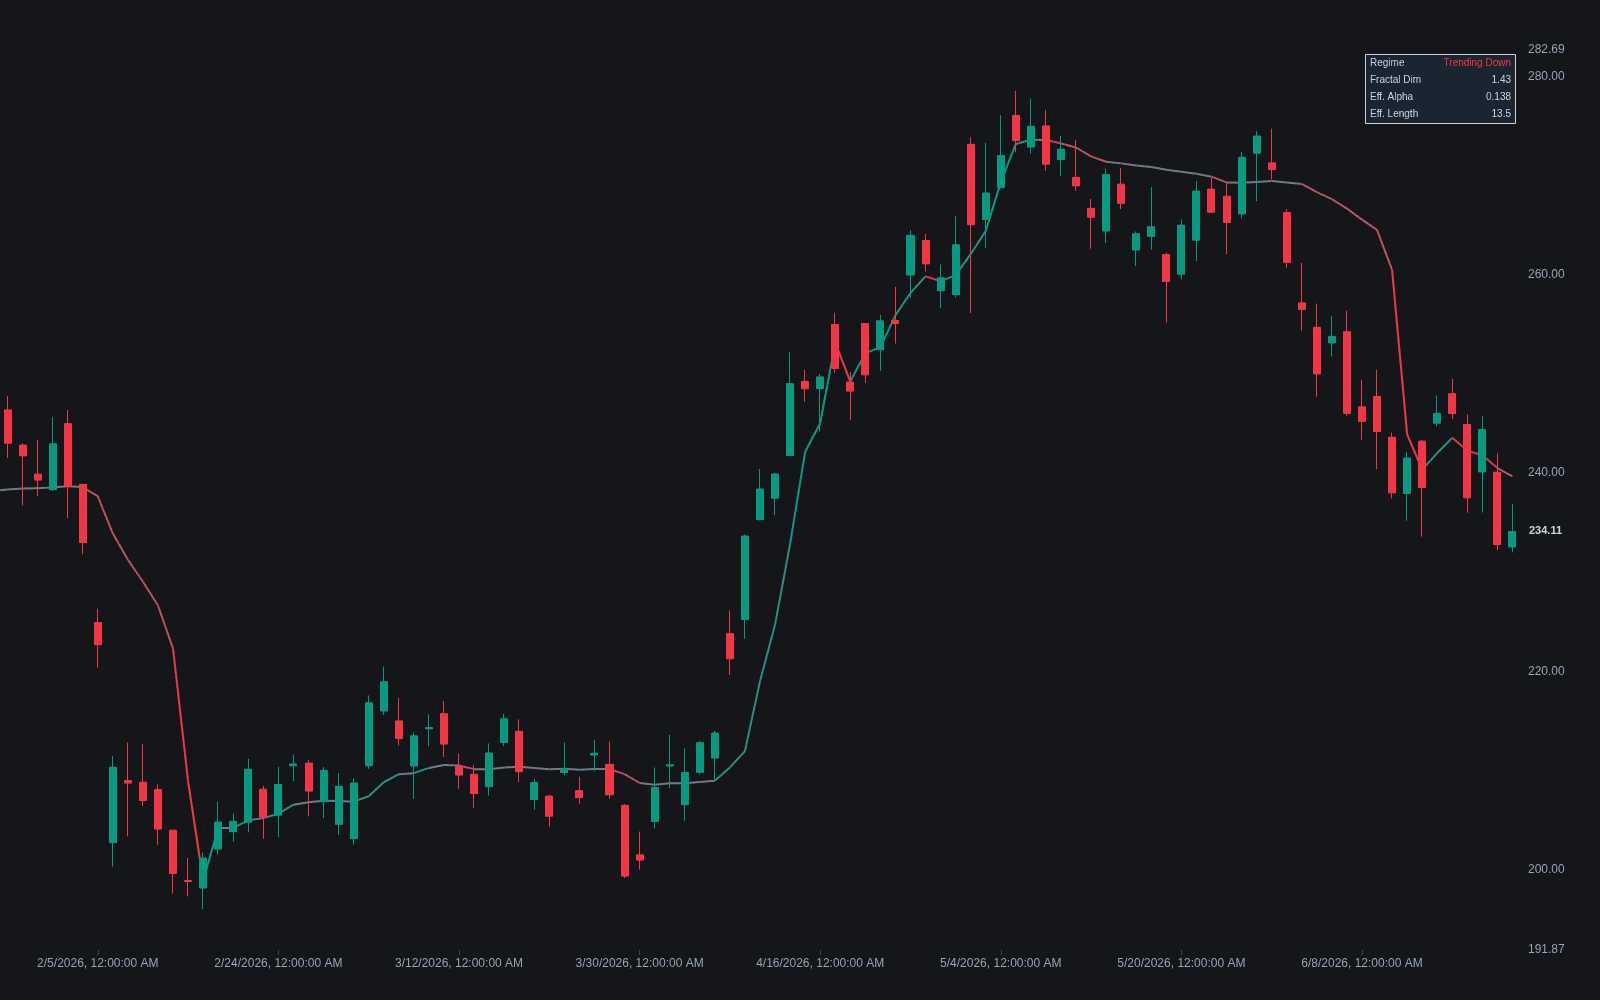
What is FRAMA?
FRAMA, the fractal adaptive moving average, is John Ehlers' adaptive smoother: an EMA whose smoothing factor is recomputed every bar from the estimated fractal dimension of recent price. The dimension is estimated with a box-counting shortcut that compares the high-low range of the full window against the ranges of its two halves. A dimension near 1 says price traced something close to a straight line; near 2 says it filled space like noise.
Ehlers, an engineer who spent a career applying digital signal processing to markets, introduced FRAMA in the mid-2000s within a filter family that includes the MESA adaptive averages and the Ehlers SuperSmoother. The premise borrows from Mandelbrot: price paths are roughly self-similar, so if roughness can be measured, it can drive the filter.
The mechanics map the dimension through an exponential so the smoothing factor runs from about 0.01 (nearly flat) in the choppiest conditions to 1 (hugging price) in the cleanest trends, with 16 bars as the published window. The design goal is the standard adaptive-MA bargain: track trends with little lag and flatten through congestion. Kaufman's KAMA chases the same goal from an efficiency ratio, and Chande's VIDYA from momentum; FRAMA keys it to fractal geometry instead.
Why it matters: a fixed-length average commits to one point on the lag-versus-smoothness dial, while an adaptive average turns the dial automatically. In regime terms, FRAMA tries to act like a fast average whenever a trend regime is in force and like a nearly flat long one when it is not. The bargain is imperfect: the dimension estimate is backward-looking, so FRAMA is late precisely when regimes change, which is when it matters most.
How to calculate FRAMA
The published construction uses an even-length window and produces one dimension estimate, and one smoothing factor, per bar.
- 1Choose an even window N (Ehlers used 16) and split it into two halves of N/2 bars each.
- 2Compute three normalized ranges: each half's highest high minus lowest low, divided by N/2 (call them N1 and N2), and the full window's range divided by N (N3).
- 3Estimate the fractal dimension: D = (log(N1 + N2) - log(N3)) / log(2).
- 4Convert to a smoothing factor alpha = exp(-4.6 x (D - 1)), clamp it between 0.01 and 1, then update FRAMA = alpha x price + (1 - alpha) x prior FRAMA.
How it's calculated
A moving average whose smoothing speed adapts to the estimated fractal dimension of price, fast in trends and slow in congestion.
Introduced by John Ehlers (2005); the constant 4.6 makes alpha_t run from about 0.01 when D_t = 2 (choppy) up to 1 when D_t = 1 (trending).
At alpha_t = 1 the filter equals price, and at the 0.01 floor it behaves like a roughly 200 period EMA.
Modified variants map D_t to an EMA period between user chosen fast and slow limits instead of the fixed 0.01 floor.
How traders use it
- As a regime-aware trend line: swapped in for a fixed SMA or EMA in slope and crossover systems so the line accelerates in clean trends and stalls in chop, trimming some whipsaws, though not all, since the dimension estimate itself lags regime changes.
- As a congestion gauge: the effective alpha, or the fractal dimension behind it, is monitored directly; a flat FRAMA with price oscillating across it is read as ongoing congestion rather than signal.
- As dynamic support and resistance in trends, like other adaptive averages, with the usual caveat that such lines are references, not certainties.
- In crossover systems: paired with a slower fixed average or a second longer-window FRAMA, the adaptive line supplying the fast leg and the fixed line the baseline trend.
- As a band centerline: implementations like DonovanWall's Fractal Adaptive Moving Average Bands widen the line into an MA envelope-style channel, so congestion shows up as price oscillating in a flat band.
FRAMA vs other moving averages
EMA: A fixed EMA applies a constant alpha chosen once, so its lag is the same in trend and chop. FRAMA is an EMA whose alpha is recomputed every bar from the fractal dimension, behaving like a fast EMA in clean trends and a very slow one in congestion.
Adaptive-lookback MA: Adaptive-lookback averages change their effective length from some regime statistic: volatility, efficiency, or dominant cycle. FRAMA belongs to this family; its distinguishing statistic is estimated fractal dimension, with Kaufman's KAMA and Chande's VIDYA the best-known siblings.
Ehlers SuperSmoother: Also by Ehlers, the SuperSmoother is a fixed two-pole filter designed to strip high-frequency noise with minimal lag; it does not adapt to regime. FRAMA filters less surgically but re-tunes itself bar by bar; the two solve different problems and are sometimes combined.
Supertrend: Supertrend is a volatility-offset trailing line that flips sides mechanically, designed as a stop-and-signal system. FRAMA is a smoother, not a system: it outputs a line whose responsiveness varies, leaving entries, exits, and stops to the surrounding strategy.
Concept family
Trend
100 concepts mapped · 100 in the Library
FRAMA FAQ
Turn FRAMA into a trading strategy.
Take the implementation from this page into Quant, then build on it, backtest it on real data, and keep refining it in conversation.