VIDYA
 By LuxAlgoMar 11, 2026
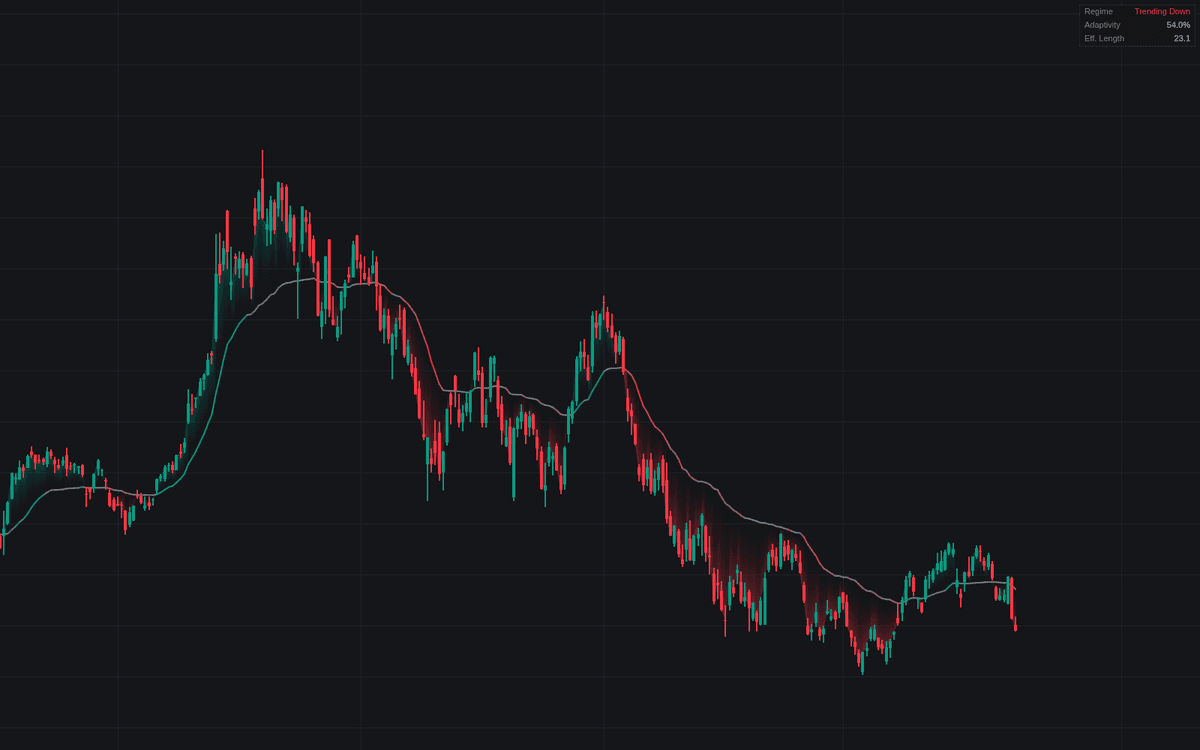

VIDYA is the definitive build of Tushar Chande's Variable Index Dynamic Average: an EMA whose smoothing constant is re-derived each bar, accelerating when movement runs one-sided and flattening when it balances out. It includes both published scalers (the widely used absolute-CMO momentum form and Chande's original 1992 standard-deviation ratio) plus an ATR-normalized slope test separating trending from flat regimes and a dashboard with the live effective length.
How to Trade the VIDYA?
- Slope regimes: the line reads bullish while its normalized slope clears the flat threshold, bearish below the negative, and flat inside congestion. Each transition is alerted.
- Breakouts from flat: price breaking away from a flattened VIDYA marks the potential start of a directional phase, both directions alerted.
- Price crossings: the source crossing VIDYA is the classic entry grammar; markers are optional, the crossing alerts work regardless.
VIDYA Settings
- Source (default close): series the average smooths.
- VIDYA Length (default 12): EMA-equivalent base length the scaler rescales bar by bar.
- Adaptive Scaler (default Momentum (|CMO|)): the momentum form, or Volatility (StDev Ratio) for Chande's original reading.
- Scaler Lookback (default 9): the CMO period, or the short standard-deviation window in volatility mode.
- Reference StDev Length (default 30): volatility mode only, the reference the short window is divided by.
- Flat Threshold (default 0.05) with ATR Normalization Length (default 14): the slope cut, as a fraction of ATR, separating congestion from directional phases.
- Show Dashboard (default enabled): regime, adaptivity, and effective-length readouts.
- Style toggles: Trend Regime Coloring, Adaptive Gradient, and Price / VIDYA Gradient Fill (default enabled); Price Crossing Markers (default disabled); Line Width (default 2).
Frequently Asked Questions

Original indicatorBuilt in-house by LuxAlgo
The Library is free. Quant makes it yours.
Pull any concept or indicator into Quant: rebuild it, retune it, or turn it into a backtested strategy of your own.