Hilbert Transform
 By LuxAlgoFeb 15, 2026
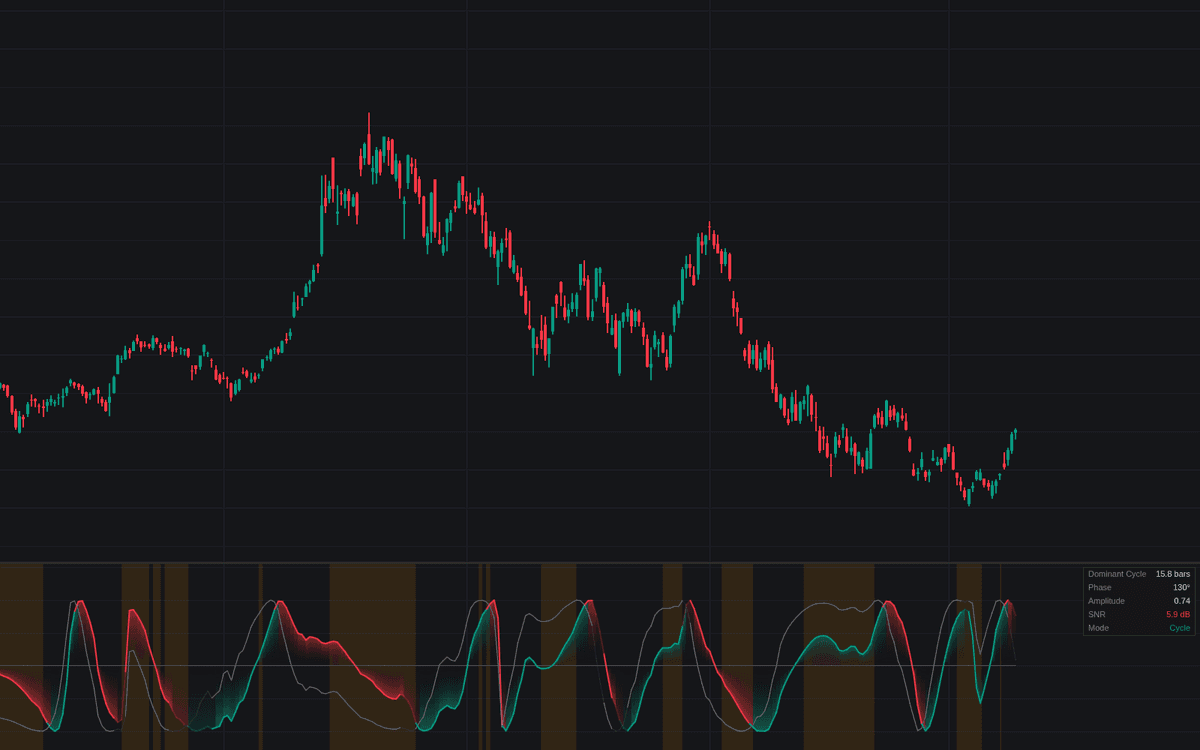

Hilbert Transform packages the Hilbert transform cycle engine as an honestly guarded pane tool. The source is smoothed, detrended and run through Ehlers' published quadrature filters; a homodyne discriminator turns per-bar phase advance into a dominant cycle period, clamped to the measurable 6-50 bar band. From the measured phase come two pane views: the sinewave with a lead line running 45 degrees ahead, or the period estimate itself. Two guards keep the output honest: a signal-to-noise gate that dims everything when cycle amplitude is too small to trust, and a trend-mode background flagging when phase stops advancing at the cycle rate.
How to Trade the Hilbert Transform?
- Lead crosses above the sinewave: an anticipated cycle trough, covered by the Cycle Turn Up alert.
- Lead crosses under the sinewave: the anticipated crest, mirrored by Cycle Turn Down.
- Trend-mode background on: phase has stalled against the expected rate. Ignore sinewave crossings and switch to trend tactics.
- Dimmed pane: SNR sits below the threshold; phase readings are noise, so cycle tactics go on hold.
The Dominant Cycle Period view is the lookback an adaptive tool would inherit.
Hilbert Transform Settings
- Source (default hl2): the bar midpoint the published designs assume.
- Min Period (default 6) and Max Period (default 50): clamps of the measured period.
- Dim Output Below SNR Threshold (default enabled) with SNR Threshold (dB) (default 6.0): the amplitude gate; SNR alerts fire whether or not dimming is on.
- Pane Output (default Sinewave): sinewave plus lead line, or the dominant cycle period.
- Display & style toggles: turn markers off, trend-mode highlight on, dashboard on, gradient fill on.
Frequently Asked Questions

The Library is free. Quant makes it yours.
Pull any concept or indicator into Quant: rebuild it, retune it, or turn it into a backtested strategy of your own.