Concept
Hilbert Transform
Hilbert Transform is a Statistics concept. The Library holds 1 implementation, a working definition you can pull into Quant.
Top Hilbert Transform indicator
The top custom implementation, built on the original standard Hilbert Transform formula.
1 total
From studying Hilbert Transform to trading it: take the implementation below into Quant and backtest it instantly.
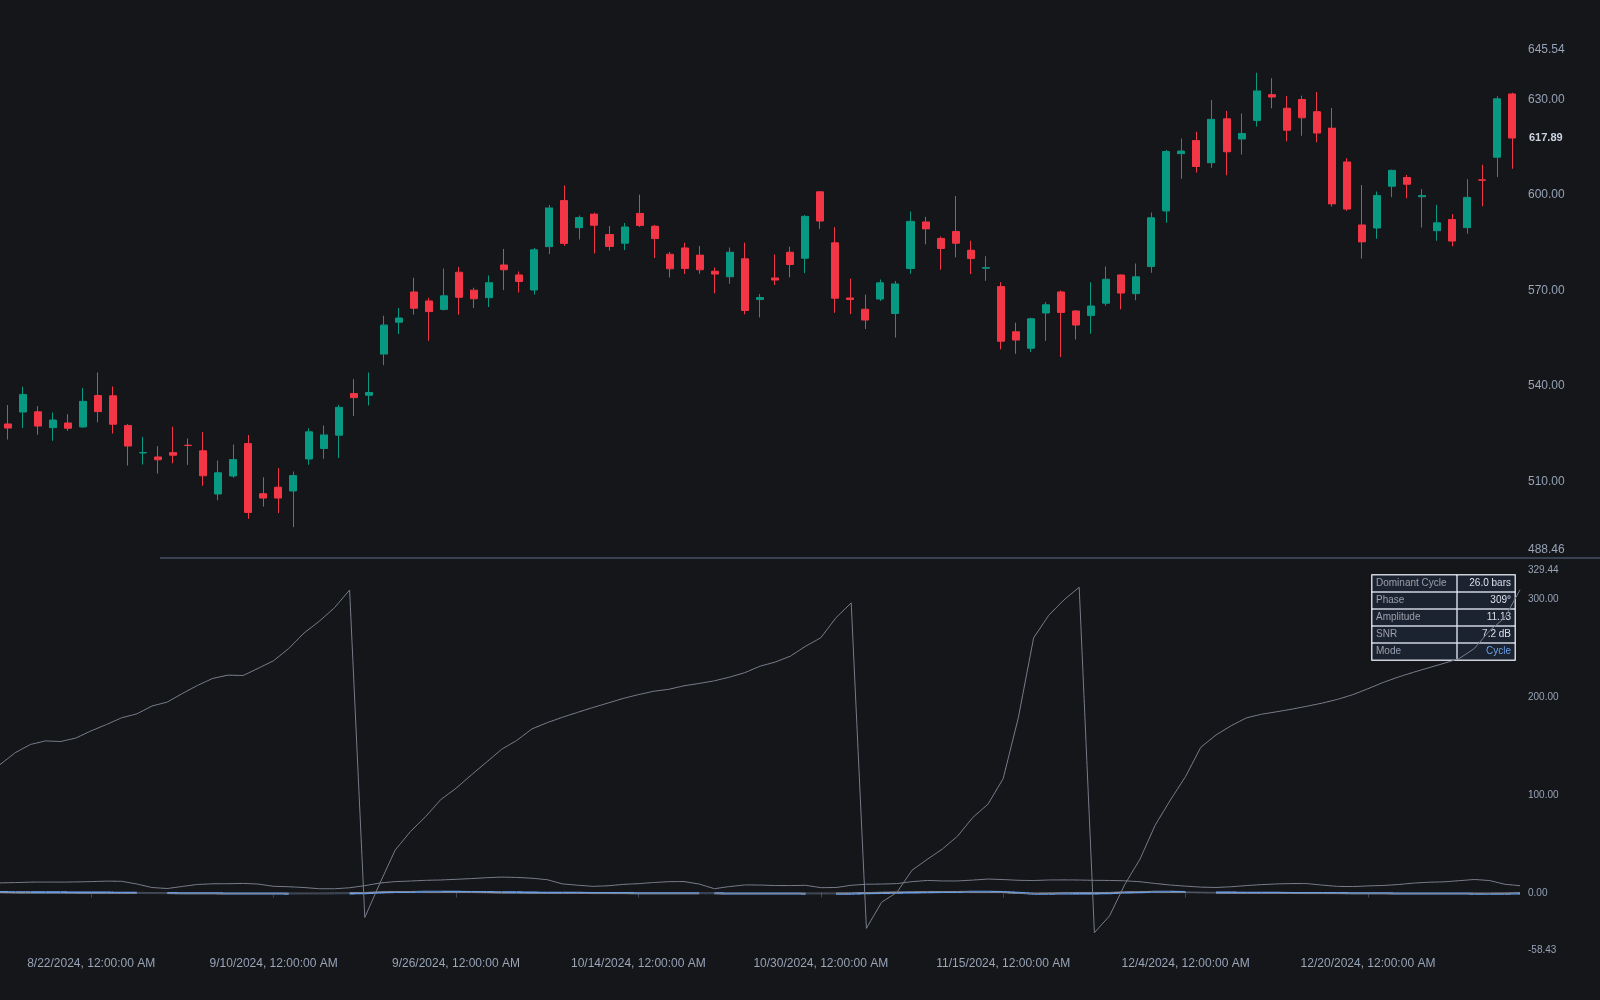
What is the Hilbert Transform?
The Hilbert transform is a signal-processing operation that shifts every frequency component of a series by 90 degrees. Pairing the original series with this shifted copy (the quadrature component) forms the analytic signal, from which two things can be read at every bar: instantaneous amplitude, the size of the current cycle, and instantaneous phase, the position within it. The rate at which phase advances is instantaneous frequency, and its inverse is the cycle period.
John Ehlers adapted the transform for trading with short filter approximations, making it the engine of the DSP tradition in charting: dominant cycle measurement, phase tools like the sinewave indicator, and adaptive averages such as MAMA/FAMA that retune themselves to the measured period. The caveat: the math assumes a reasonably clean oscillation, which raw price is not, so implementations detrend and smooth first and still produce estimates that jitter around regime changes.
Chart implementations cannot compute the textbook transform, which needs an infinite window; they approximate the 90-degree shift with short weighted-difference filters spanning a handful of bars, applied after detrending. Ehlers' published designs, the reference most Library scripts follow, pair that quadrature approximation with a homodyne discriminator, which averages successive phase differences to steady the period estimate, and constrain measurable cycles to roughly 6 to 50 bars: a narrower but faster read than block methods like FFT/spectral analysis.
What practitioners actually consume sits downstream of the math. The MESA adaptive moving average family, represented here by vosechu's Ehlers MESA Adaptive Moving Average and cheatcountry's Mother of Adaptive Moving Averages, retunes its smoothing to the measured phase rate each bar. Sine-wave tools project the dominant cycle as an oscillator with an anticipatory lead line, and jacobnie2008's Hilbert Sine Wave Support and Resistance maps cycle extremes onto price levels. Ehlers also recommends gating everything on signal-to-noise: when measured amplitude is small relative to noise, cycle tools should stand down.
How to identify Hilbert transform outputs on a chart
You rarely plot the transform itself; you meet its outputs, period, phase and amplitude, inside other tools. Auditing them follows the processing chain.
- 1Confirm the input is detrended, typically by differencing or subtracting a smooth, because the analytic-signal math assumes a roughly zero-mean oscillation and trend leaks into phase as a spurious slow cycle.
- 2Check the quadrature stage: a short weighted-difference filter approximating the 90-degree shift, usually following Ehlers' published coefficients.
- 3Read amplitude and phase from the analytic pair, the price component against the quadrature component, at each bar.
- 4Verify the period logic: phase should advance roughly 360 degrees over one measured cycle, with a homodyne or similar averaging stage steadying the estimate.
- 5Look for an amplitude or signal-to-noise gate; an implementation that acts on phase while amplitude is negligible is trading noise.
How it's calculated
A 90-degree phase-shifted copy of the price series that, paired with the original, yields the instantaneous phase, amplitude, and dominant cycle period of the market cycle.
The exact Hilbert Transform is an infinite-length convolution that shifts every frequency component by 90 degrees; the 4-coefficient filter above is John Ehlers' finite approximation, tuned for cycle periods of roughly 6 to 50 bars.
In Ehlers' full dominant-cycle measurement the same filter is applied twice (once to detrend, once for quadrature), I and Q are smoothed, and the bar-to-bar change in Period is limited to about 0.67x to 1.5x of the prior value.
TA-Lib's HT_TRENDLINE, HT_DCPERIOD, HT_PHASOR, and HT_SINE are all built on this construction.
How traders use it
- To measure the dominant cycle period, which then drives adaptive lookbacks for oscillators and moving averages instead of fixed settings.
- To trade phase directly: phase-based tools anticipate cyclic turns as phase approaches its extremes, rather than waiting for a lagging crossover after the turn.
- To classify trend versus cycle mode: when measured phase stops advancing at the expected cycle rate, DSP systems switch from cycle tactics to trend tactics.
- To draw cyclical support and resistance: projecting the measured amplitude around a centerline turns the abstract cycle into price levels that update as the cycle evolves.
- To gate other systems: measured signal-to-noise decides whether cycle tactics are allowed at all, suppressing oscillator entries when amplitude is too small to trade.
Hilbert transform vs other cycle and estimation tools
FFT/Spectral Analysis: The FFT decomposes a whole window into many frequencies at once, assuming the content held still across it. The Hilbert transform gives one instantaneous estimate per bar and tracks change quickly, but only for the dominant cycle; it cannot see several cycles at once.
Kalman Filter: A Kalman filter estimates hidden state from an explicit model with specified noise, and its quality depends on that model being right. The Hilbert approach is nearly model-free, extracting phase and amplitude directly, which makes it more flexible and less principled.
Autocorrelation: Autocorrelation finds the period by locating the lag where the series best matches itself, a robust but coarse read. Ehlers himself moved toward autocorrelation periodograms in later work because raw Hilbert period estimates jitter in noise; the transform still wins on per-bar phase.
Concept family
Statistics
46 concepts mapped · 46 in the Library
Hilbert Transform FAQ
Turn Hilbert Transform into a trading strategy.
Take the implementation from this page into Quant, then build on it, backtest it on real data, and keep refining it in conversation.