Laguerre RSI
 By LuxAlgoMay 5, 2026
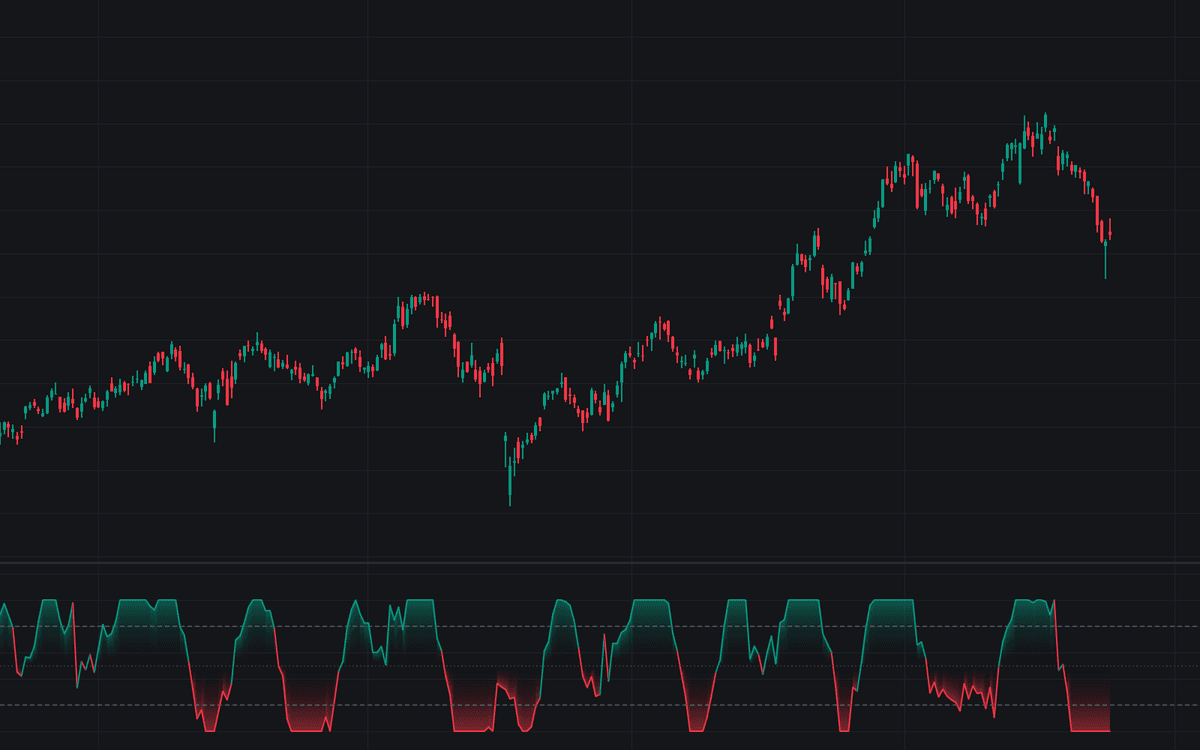

Laguerre RSI delivers the Laguerre RSI in its cleanest form: the source runs through four cascaded filter stages steered by one shared Gamma value, the pairwise gaps between successive stages split into up-pressure and down-pressure, and the pane shows the up-share of the total, scaled 0 to 1. When a move persists, all three gaps lean the same way and the reading pins near 1 or 0 until the move gives out - the oscillator's defining behavior.
How to Trade the Laguerre RSI?
- Pinned above 0.8: a persistent advance in progress, not a stretched market - the aligned play is holding with the move, not fading it.
- Drop back below 0.8: the actionable event after a pinned stretch - an advance-exhaustion cue, covered by the Overbought Exit alert.
- Recovery up through 0.2: the mirror cue for declines, covered by the Oversold Recovery alert.
- Midline side: the line and gradient color bullish above 0.5 and bearish below, a quick bias read between threshold events.
Entries into the extreme zones carry alerts too, so the full cycle - move begins, persists, exhausts - is observable without watching the pane.
Laguerre RSI Settings
- Source (default close): the series feeding the cascade; raw price works best, leaving the smoothing to the cascade itself.
- Gamma (default 0.5): the single damping knob. Lower reacts quicker but noisier; higher smooths harder and holds levels longer, with most tuning landing between 0.5 and 0.8.
- Overbought (default 0.8) and Oversold (default 0.2): decision thresholds whose exits, not entries, carry the signals.
- Gradient Fill (default on) and Threshold Exit Markers (default off): style toggles - the matching alerts fire regardless.
Frequently Asked Questions

Original indicatorBuilt in-house by LuxAlgo
The Library is free. Quant makes it yours.
Pull any concept or indicator into Quant: rebuild it, retune it, or turn it into a backtested strategy of your own.