Concept
Laguerre RSI
Laguerre RSI is a Momentum & Oscillators concept. The Library holds 1 implementation, a working definition you can pull into Quant.
Top Laguerre RSI indicator
The top custom implementation, built on the original standard Laguerre RSI formula.
1 total
Want to trade Laguerre RSI? The implementation below is one prompt away from a backtested strategy in Quant.
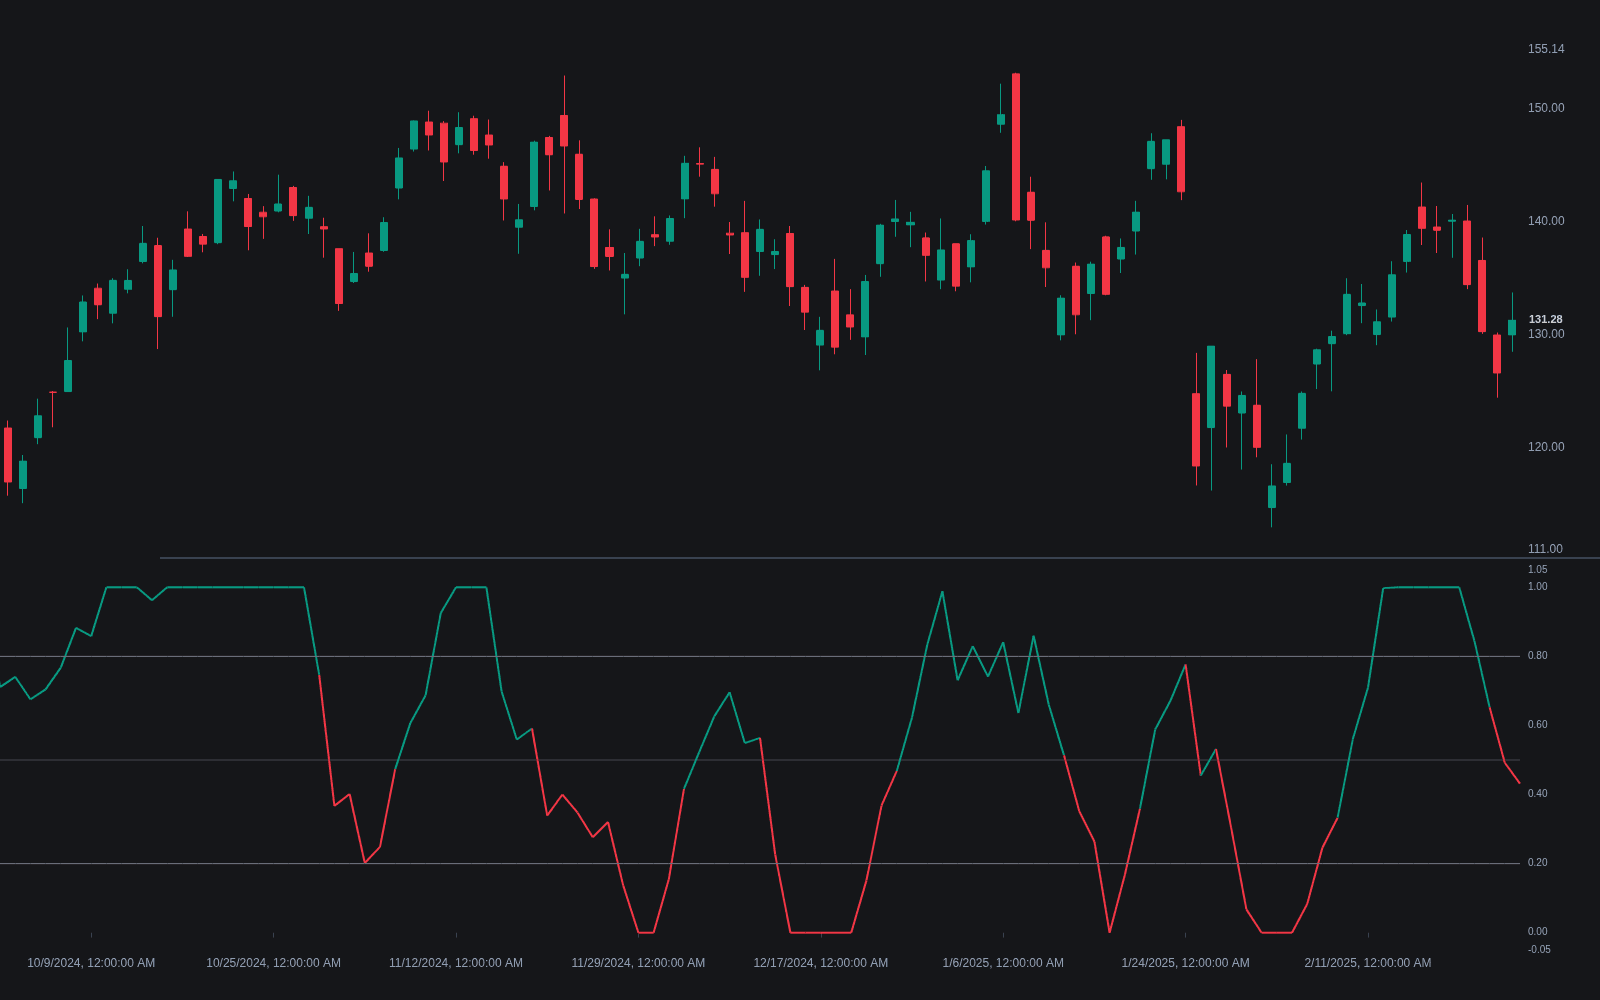
What is the Laguerre RSI?
The Laguerre RSI is John Ehlers' reworking of RSI in which the lookback window is replaced by a four-stage Laguerre filter. Price runs through a cascade of four filter stages governed by a single damping factor, gamma, between 0 and 1. The RSI-style ratio of up moves to total moves is then computed from the differences between successive filter stages rather than from raw bar-to-bar changes, and the output is scaled 0 to 1.
The point of the Laguerre structure is time warping: with only four terms, the filter weights recent prices heavily while keeping a long decaying memory of older ones, something a plain moving average would need far more periods (and far more lag) to approximate. The result is an oscillator that plots very smooth yet still turns quickly, and that tends to pin near 1 in strong up-moves and near 0 in strong down-moves; 0.8 and 0.2 are the common decision thresholds.
Mechanically, each bar compares the four stage outputs pairwise: where a faster stage sits above the slower one below it, the gap adds to the up-sum, and where it sits below, to the down-sum. The plotted value is the up-sum divided by the total. In a persistent advance all three gaps stay positive, the down-sum starves, and the oscillator sits at or near 1 for as long as the move lasts; that pinning is information about trend persistence, not a malfunction. Ehlers published the design alongside the filter itself in his early-2000s Time Warp work and the Cybernetic Analysis book.
The Library carries the lineage from TheLark's early port through KivancOzbilgic's widely used version to everget's Fractals Energy variant, which measures how choppy the market is and feeds that into the damping factor, slowing the oscillator in congestion and quickening it in clean moves, an adaptive RSI in spirit. The honest caveats: the 0 to 1 pinning that makes it a good trend-hold tool makes classic overbought/oversold fading dangerous, and one gamma controls everything, so small setting changes move every behavior at once.
How to identify the Laguerre RSI on a chart
It reads like an RSI with smoother manners: same idea, different scale. The tells are quick to check.
- 1Check the scale: 0 to 1 with decision lines at 0.8 and 0.2, instead of RSI's 0 to 100 with 70/30.
- 2Check the input: a single gamma (or an adaptive alpha) rather than a bar-count length.
- 3Watch the character: long flat stretches pinned near 1 in advances and near 0 in declines, with smooth, rounded transitions between them.
- 4Confirm the construction where source is visible: up and down sums built from differences between four cascaded Laguerre stages.
- 5Read events at the thresholds: the drop back through 0.8 after a pinned stretch, or the cross up through 0.2, are the signals implementations act on, sometimes with divergence as a secondary read.
How it's calculated
A momentum oscillator between 0 and 1 that measures up versus down pressure across the stages of a Laguerre-filtered price series instead of raw price changes.
Some implementations take alpha = 1 - gamma as the input, and many rescale the output to a 0 to 100 range.
Common signal levels are 0.8 overbought and 0.2 oversold (80 and 20 when rescaled).
Introduced by John Ehlers in Cybernetic Analysis for Stocks and Futures; initialize L0 through L3 to the first price to limit warm-up artifacts.
How traders use it
- As a trend-hold read: the oscillator staying pinned above 0.8 marks a persistent up-move, and the drop back below that level is used as an exhaustion or exit cue, mirrored at 0.2 for down-moves.
- As a reversal trigger in range conditions: crossing back up through 0.2 or down through 0.8 gives mean-reversion entries, best filtered by a regime check since those signals fail badly in trends.
- As a one-knob oscillator: gamma alone sets responsiveness, lower values reacting faster and higher values smoothing harder, which is why adaptive variants tie gamma to a volatility or fractal-energy measure.
- As a location-gated trigger: taking the 0.2 cross-up only at mapped support, or the 0.8 cross-down only at resistance, converts a generic oscillator event into a level-confirmation tool.
- As the fast layer in oscillator stacks: its smoothness at speed makes it a common companion to slower fixed-window reads, flagging turns early that the standard oscillator confirms later.
Laguerre RSI vs related oscillators
RSI: Standard RSI averages gains and losses over a fixed window and rarely reaches its extremes; the Laguerre version computes the same style of ratio from a warped-memory filter, plots far smoother, and spends whole trends pinned at 0 or 1. Same ratio idea, opposite temperament at the extremes.
Stochastic RSI: Both answer the complaint that RSI feels sluggish, from opposite directions. Stochastic RSI stretches RSI's range and amplifies its noise; the Laguerre RSI suppresses noise while keeping speed. One buys sensitivity with whipsaw, the other buys smoothness with pinning.
Adaptive/dynamic RSI: Adaptive RSIs keep the classic formula and vary the lookback with conditions. The Laguerre RSI discards the lookback entirely for a filter cascade. The Fractals Energy variant merges the two ideas by driving the Laguerre damping factor from a measured choppiness input.
Concept family
Momentum & Oscillators
91 concepts mapped · 91 in the Library
Laguerre RSI FAQ
Turn Laguerre RSI into a trading strategy.
Take the implementation from this page into Quant, then build on it, backtest it on real data, and keep refining it in conversation.