Measured Move
 By LuxAlgoJul 22, 2026
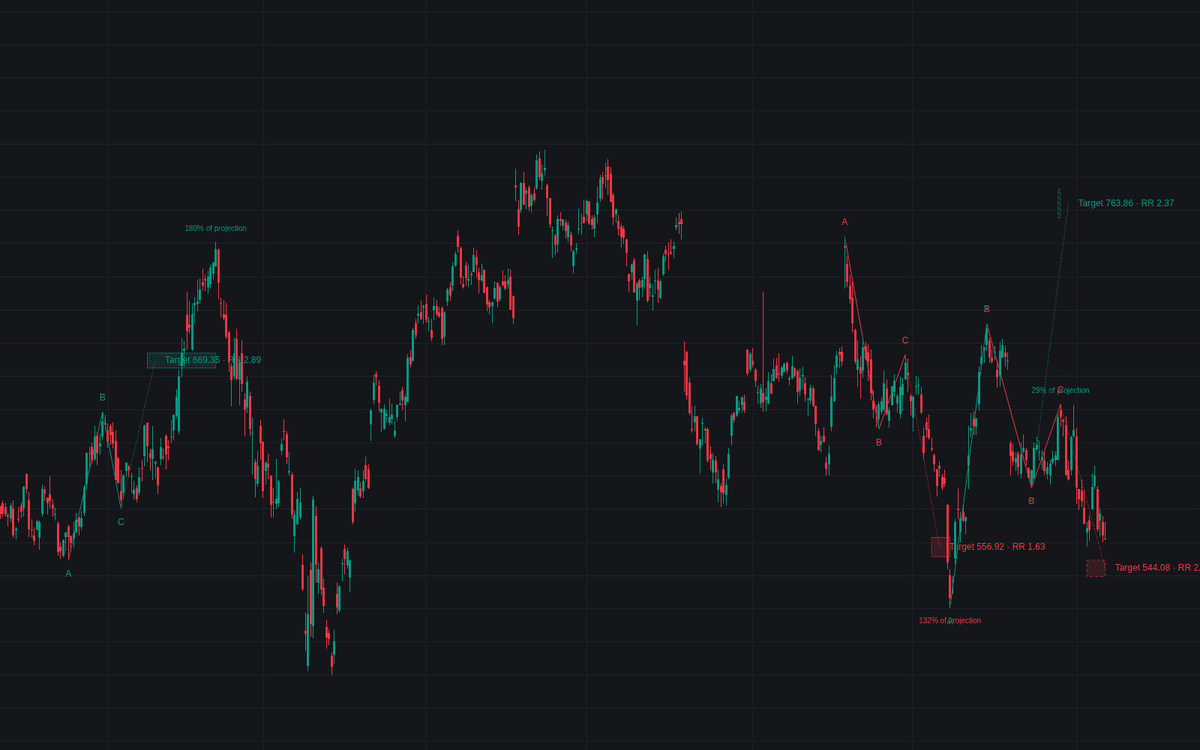

Measured Move turns leg symmetry into levels that can be planned around. Whenever three alternating confirmed swings form a trending leg and a proportional correction, the build projects the measured move: the A-B distance carried forward from C, drawn as a dotted expected leg into a shaded target zone rather than a single line, since symmetry between legs is approximate. The target label carries the projected price and the reward-to-risk of entering at C with the stop at A; a finished second leg prints its size as a percentage of the projection.
How to Trade the Measured Move?
- Target zone: the dashed box around the projection is the objective region; its border turns solid the moment price tags it.
- RR label: the ratio pre-computes the trade the structure implies (target distance over stop distance from C) so marginal setups can be skipped before entry.
- Second leg %: a finished leg well short of the projection flags fading momentum; one beyond it, a trend running hotter than symmetry.
- Void mark: a correction retracing the entire first leg voids the construction, muting its zone and marking an ✕.
Measured Move Settings
- Swing Length (default 10): bars each side confirming the anchoring swings.
- Min Retracement % (default 33.3) and Max Retracement % (default 66.7): the proportional-correction window.
- Projection Method (default Points): C + (B − A), or Percentage for the ratio form C × (B / A), preferred on log-scale charts.
- Projection Multiple (default 1.0): the share of the leg projected: 0.618 or 1.272 give fractions or extensions.
- Target Zone Width % (default 10): zone height as a percentage of the projected distance.
- Style: Show Legs, Show Swing & Target Labels and Show Second Leg % (all on), Shown Patterns (default 20).
Frequently Asked Questions

Original indicatorBuilt in-house by LuxAlgo
The Library is free. Quant makes it yours.
Pull any concept or indicator into Quant: rebuild it, retune it, or turn it into a backtested strategy of your own.