Concept
Measured Move
Measured Move is a Market Structure concept. The Library holds 1 implementation, a working definition you can pull into Quant.
Top Measured Move indicator
The top custom implementation, built on the original standard Measured Move formula.
1 total
The Measured Move implementation below can become a backtested trading strategy — describe your rules and Quant writes the code.
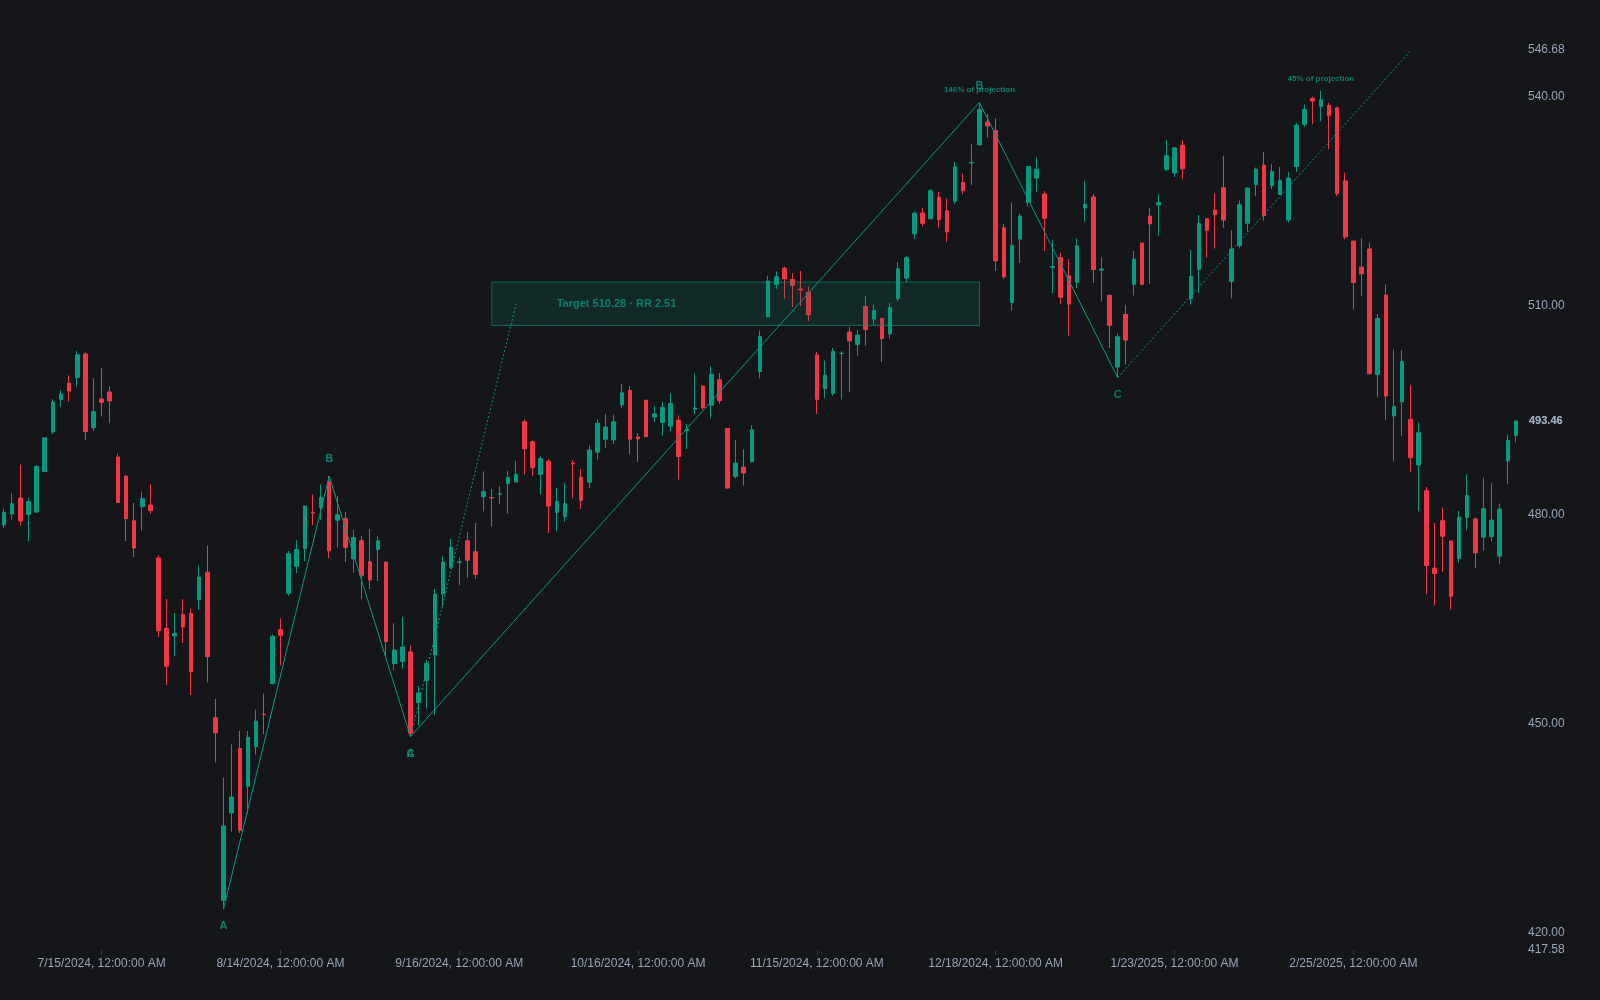
What is a measured move?
A measured move is a price projection built on the tendency of trends to unfold in legs of similar size. The classic form has three parts: an initial impulse leg, a corrective pullback, and a second leg assumed to roughly match the first. Measuring the first leg and projecting that distance from the end of the correction gives a target for the second leg. The idea is a staple of classical charting, where the bullish and bearish variants are often described as the measured move up and measured move down patterns.
The technique exists because symmetry between legs shows up often enough to be useful for planning. It is not a law: second legs regularly run short or extend well beyond the projection. What the measured move provides is a pre-committed, objective reference point, which matters because targets chosen after entry tend to drift with emotion. It also generalizes widely; flag and pennant targets, swing projections, and the AB=CD construction all apply the same one-to-one leg logic.
Traders care because the projection converts structure into an actionable number. Given an entry near the end of the correction, the measured target defines potential reward, and comparing it against the stop distance yields a risk-reward estimate before the trade is taken rather than after.
How to identify a measured move setup on a chart
The pattern needs a clean first leg and a genuine correction, not just any three swings.
- 1Locate a directional first leg with a clear start and end, anchored on objective swing points rather than intrabar extremes chosen by eye.
- 2Confirm a proportional correction: a pullback retracing part of the first leg, commonly in the one-third to two-thirds region, without fully reversing it.
- 3Anchor the projection at the correction's terminal swing once price turns back in the trend direction.
- 4Project the first leg's length from that anchor and mark the target; treat it as a zone, since symmetry is approximate.
- 5Reassess if the correction deepens beyond the first leg's origin, which voids the construction entirely.
How it's calculated
The standard arithmetic projection for the bullish case, with the bearish case mirrored.
A percentage variant projects the first leg's ratio instead of its point distance: target_up = C * (B / A). It is preferred on log-scale charts and for large moves where point symmetry distorts.
Some traders project a fraction or multiple of the first leg (for example 0.618 or 1.272) rather than 1.0, which shades the method into Fibonacci projection territory.
How traders use it
- As a profit target: entries taken near the end of the correction are paired with the measured target, often scaling out as price approaches it rather than demanding a precise touch.
- As a trade filter: if the measured target sits too close to the entry relative to the stop, the trade is skipped for insufficient reward, whatever the pattern quality.
- As a trend-health gauge: second legs that fall well short of the projection suggest fading momentum, while legs that exceed it comfortably indicate a strong trend worth holding.
- As a component of confluence: a measured target landing near a prior level or a Fibonacci extension carries more weight than either reference alone. The projection remains an estimate, and price owes it nothing.
Measured move vs related projection methods
Measure rule: The measure rule projects the internal height of a chart pattern, such as a rectangle or triangle, from its breakout point. The measured move projects a prior trend leg from a correction. Same spirit, different measured object.
AB=CD: AB=CD formalizes the same leg-symmetry idea within harmonic trading, adding specific Fibonacci ratio requirements for the correction and alternate leg ratios. A textbook measured move is essentially an AB=CD without the ratio tests.
Fibonacci projection: Fibonacci projection generalizes the measured move by projecting ratios other than 1.0 of the first leg, giving a ladder of candidate targets instead of a single symmetric one.
Concept family
Market Structure
31 concepts mapped · 31 in the Library
Measured Move FAQ
Turn Measured Move into a trading strategy.
Take the implementation from this page into Quant, then build on it, backtest it on real data, and keep refining it in conversation.