Psychological Line
 By LuxAlgoMar 23, 2026
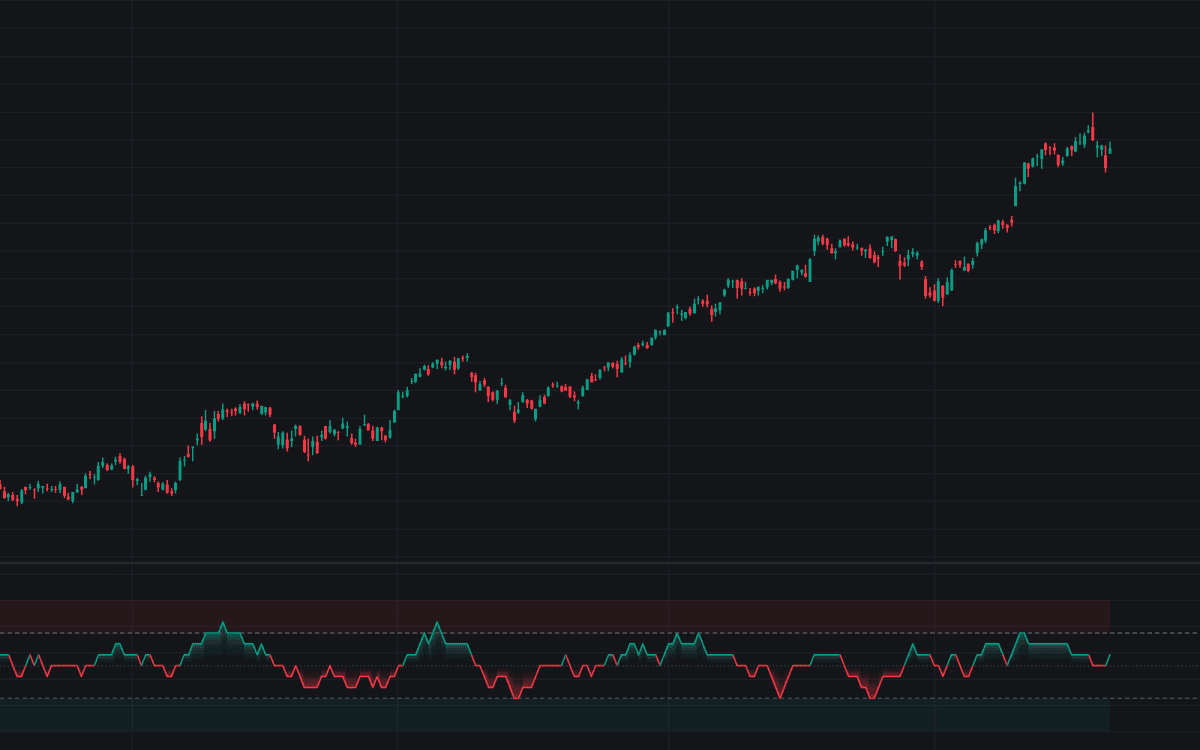

Psychological Line plots the share of up closes in a rolling window: with the default 12-bar Length, every bar finishing above the prior close adds one twelfth, so the line steps between 0% and 100% and reads as the market's recent win rate. This is the definitive clean build of the Psychological Line: the line and its gradient fill turn bullish above the 50% balance line and bearish below it, dashed levels sit at 75 and 25, and the discrete one-step movement on the default window is the design, not a rendering artifact.
How to Trade the Psychological Line?
- Above 75%: nine of the last twelve bars rose, a one-sidedly optimistic tape. Strong trends can pin the reading, so the classical trigger is the step back below the level, not the touch.
- Below 25%: the pessimistic mirror; the actionable event is the recovery back up through it.
- Balance-line crosses: a move through 50% marks up closes taking or losing the majority, a simple persistence bias filter.
Optional circles mark the threshold exits, and six alerts cover both threshold entries, both exits, and both balance-line crosses.
Psychological Line Settings
- Length (default 12): bars in the counting window; 13 is a common fast alternative, windows near 25 flag only sustained one-sidedness.
- Source (default close): series whose bar-to-bar direction is counted. Only the sign of each change matters.
- Overbought (default 75) and Oversold (default 25): the one-sidedness thresholds.
- Smoothed PSY (default disabled) with Type (default SMA) and Length (default 6): a moving-average overlay (fewer whipsaws, later turns).
- Gradient Fill (default enabled), Threshold Exit Markers (default disabled), and the color inputs handle presentation.
Frequently Asked Questions

The Library is free. Quant makes it yours.
Pull any concept or indicator into Quant: rebuild it, retune it, or turn it into a backtested strategy of your own.