Concept
Psychological Line
Psychological Line is a Momentum & Oscillators concept. The Library holds 1 implementation, a working definition you can pull into Quant.
Top Psychological Line indicator
The top custom implementation, built on the original standard Psychological Line formula.
1 total
The Psychological Line implementation below can become a backtested trading strategy — describe your rules and Quant writes the code.
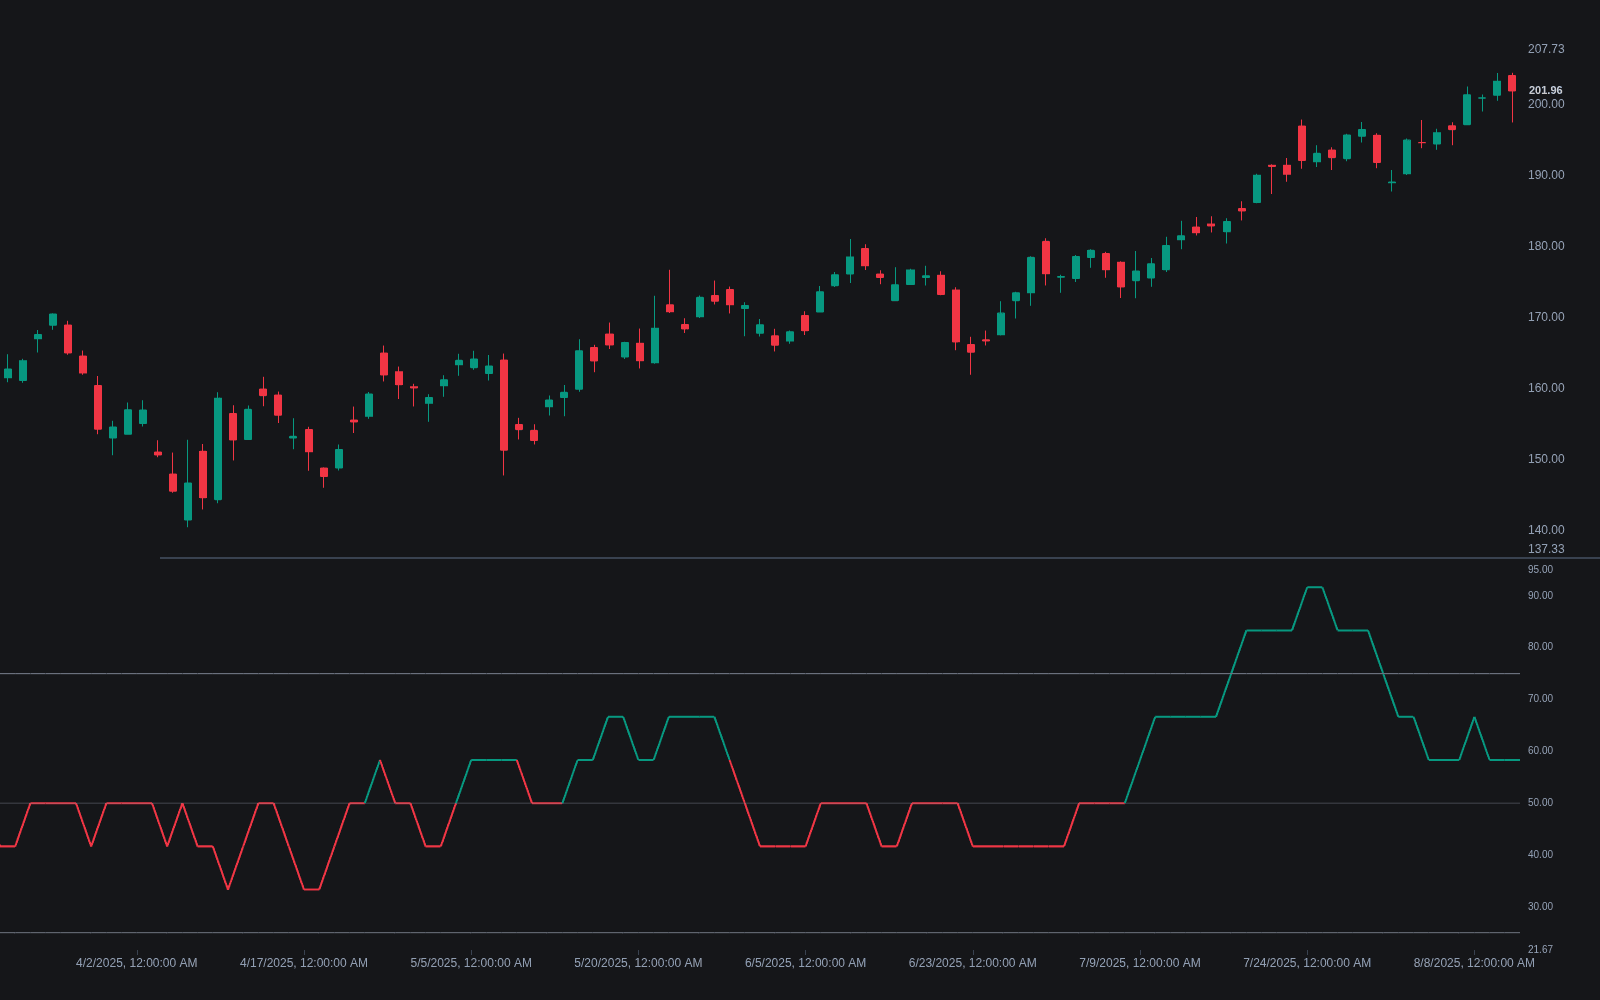
What is the Psychological Line?
The Psychological Line (PSY) measures how often a market closes up, not how far. Over a lookback window, commonly 12 bars, it counts the bars that closed above the prior close and expresses that count as a percentage of the window: 50% means up and down closes are balanced, 75% means nine of the last twelve bars rose. The name reflects the intent, persistent one-sided closes read as a proxy for crowd mood, and the line is a staple of Japanese and Chinese charting traditions.
Unlike most Western oscillators, PSY has no celebrated inventor. It circulates through Japanese and Chinese technical-analysis literature, ships as a standard study on East Asian platforms while staying comparatively niche on Western ones, and no reliable attribution survives. Formally it is a rolling frequency statistic, the market's recent 'win rate': up closes in the window divided by window length, times 100. Twelve and thirteen bars are common fast settings; slower variants sit near 25.
Every bar votes equally regardless of size, so PSY is deliberately blind to magnitude: twelve small up closes score higher than eleven large ones, and the default line moves in discrete steps of one-twelfth. That bluntness is the trade-off. It isolates persistence, which magnitude-weighted gauges like ROC blur together, but it says nothing about what the up closes achieved, so it is usually read alongside a magnitude-aware tool.
Placing PSY among oscillators clarifies its niche. RSI weighs average gain against average loss, the stochastic oscillator locates the close within the recent range, and PSY discards all of that to keep only each bar's sign. That makes it unusually robust to single outlier candles, which move it by at most one step, and equally blind to them. Its users value exactly that: a clean, bounded read on how one-sided the tape has been.
How to read the Psychological Line on a chart
PSY plots as a stepped 0-100 oscillator; reading it well means respecting those steps.
- 1Apply the indicator and set the window: 12 bars is the widespread default, and the coarse one-twelfth steps are normal, not a rendering error.
- 2Mark the working bands: 75 and 25 are conventional extremes on the 12-bar setting, with 50 as the balance line.
- 3Read persistence, not level alone: how long the line holds above 50 or pins near an extreme is the actual message.
- 4Act on the turn, not the touch: the classical read waits for the line to step back through the band before treating an extreme as meaningful.
- 5Cross-check with a magnitude gauge such as momentum or RSI: matching extremes strengthen the case, while a PSY extreme with tame magnitude often marks a grind, not a blow-off.
How traders use it
- As an overbought/oversold gauge: sustained readings above roughly 75% flag one-sided optimism that can precede a pause or pullback, with readings below roughly 25% as the mirror. Strong trends can hold extreme readings, so the thresholds are context, not automatic triggers.
- As a midline bias filter: holding above 50% says up closes dominate the recent window, a simple persistence check set alongside trend tools before taking directional signals.
- For divergence: price pressing to new highs while the frequency of up closes fades suggests the advance is being carried by fewer, larger pushes, an early fragility cue rather than a signal on its own.
- As one half of a persistence-plus-magnitude pair: a fresh price high confirmed by both PSY and MACD means the count of up bars and their size agree; when only one confirms, the disagreement is the finding worth investigating.
- In smoothed or slowed forms: a short moving average tames the discrete steps, and windows near 25 bars give a slower sentiment read; both trade responsiveness for fewer whipsaws.
Psychological Line vs related concepts
RSI: RSI asks how much the market gained versus lost across the window; PSY asks only how often it closed up. Many small up closes max PSY while leaving RSI moderate; a few violent rallies do the reverse. They disagree in informative ways.
Stochastic Oscillator: The stochastic locates the latest close within the recent high-low range, so a single dramatic bar can swing it sharply. PSY changes by at most one step per bar regardless of drama. The stochastic reads position; PSY reads persistence.
ROC: ROC is pure magnitude: the percentage change between now and N bars ago, path ignored. PSY is pure frequency: the path's composition, magnitudes ignored. Together they separate 'how far' from 'how consistently', which neither answers alone.
Concept family
Momentum & Oscillators
91 concepts mapped · 91 in the Library
Psychological Line FAQ
Turn Psychological Line into a trading strategy.
Take the implementation from this page into Quant, then build on it, backtest it on real data, and keep refining it in conversation.