Rainbow MA Stack
 By LuxAlgoJun 8, 2026
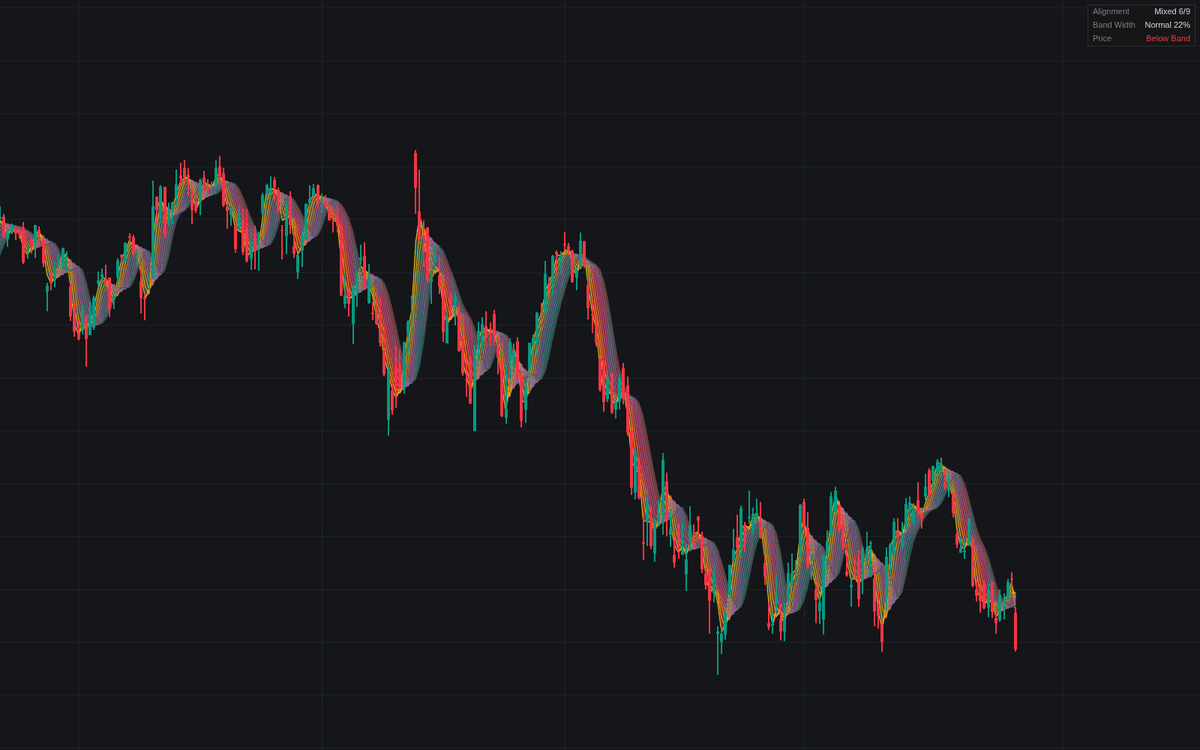

Rainbow MA Stack plots a family of moving averages as a single hot-to-cold gradient band, then quantifies the band's geometry. It ships the rainbow MA stack in its original recursive construction by default: line 1 is a 2-period simple average of price and every further line re-smooths the previous line, so inner lines hug price while outer ones carry progressively longer lag. Stepped and Fibonacci-spaced lookbacks are the alternatives; the stack always stays one family.
How to Trade the Rainbow MA Stack?
- Full bullish stack: every adjacent pair in length order, shortest on top, all horizons pulling the same way in an established uptrend. The bearish stack mirrors it.
- Braiding lines: full alignment lost (consolidation conditions, with its own alert).
- Knotted band: width at or below the 10th percentile of its 200-bar history flags compression, breakout setup bars; the 90th marks full expansion.
- Price closing through the whole band: decisive either way, each direction with an alert.
A dashboard summarizes alignment, width percentile, and price's place in the band.
Rainbow MA Stack Settings
- Construction (default Recursive (Widner)): recursive re-smoothing, Stepped Lengths, or Fibonacci Lengths.
- Number of Lines (default 10): fewer reads crossings clearly, more renders compression smoothly.
- Source (default close) and Recursive Smoothing Length (default 2): the recursion's per-step average.
- Average Family (default SMA): SMA, EMA, or VWMA for the stepped modes; the recursive mode is SMA-of-SMA by definition.
- Shortest Length (default 10) and Step (default 10): the classic 10-through-100 set.
- Width Rank Lookback (default 200) with Compression Threshold % (default 10) and Expansion Threshold % (default 90).
- Style and dashboard inputs cover the palette stops, ribbon fill, line width, and placement.
Frequently Asked Questions

Original indicatorBuilt in-house by LuxAlgo
The Library is free. Quant makes it yours.
Pull any concept or indicator into Quant: rebuild it, retune it, or turn it into a backtested strategy of your own.