Concept
Rainbow MA Stack
Rainbow MA Stack is a Trend concept. The Library holds 1 implementation, a working definition you can pull into Quant.
Top Rainbow MA Stack indicator
The top custom implementation, built on the original standard Rainbow MA Stack formula.
1 total
Want to trade Rainbow MA Stack? The implementation below is one prompt away from a backtested strategy in Quant.
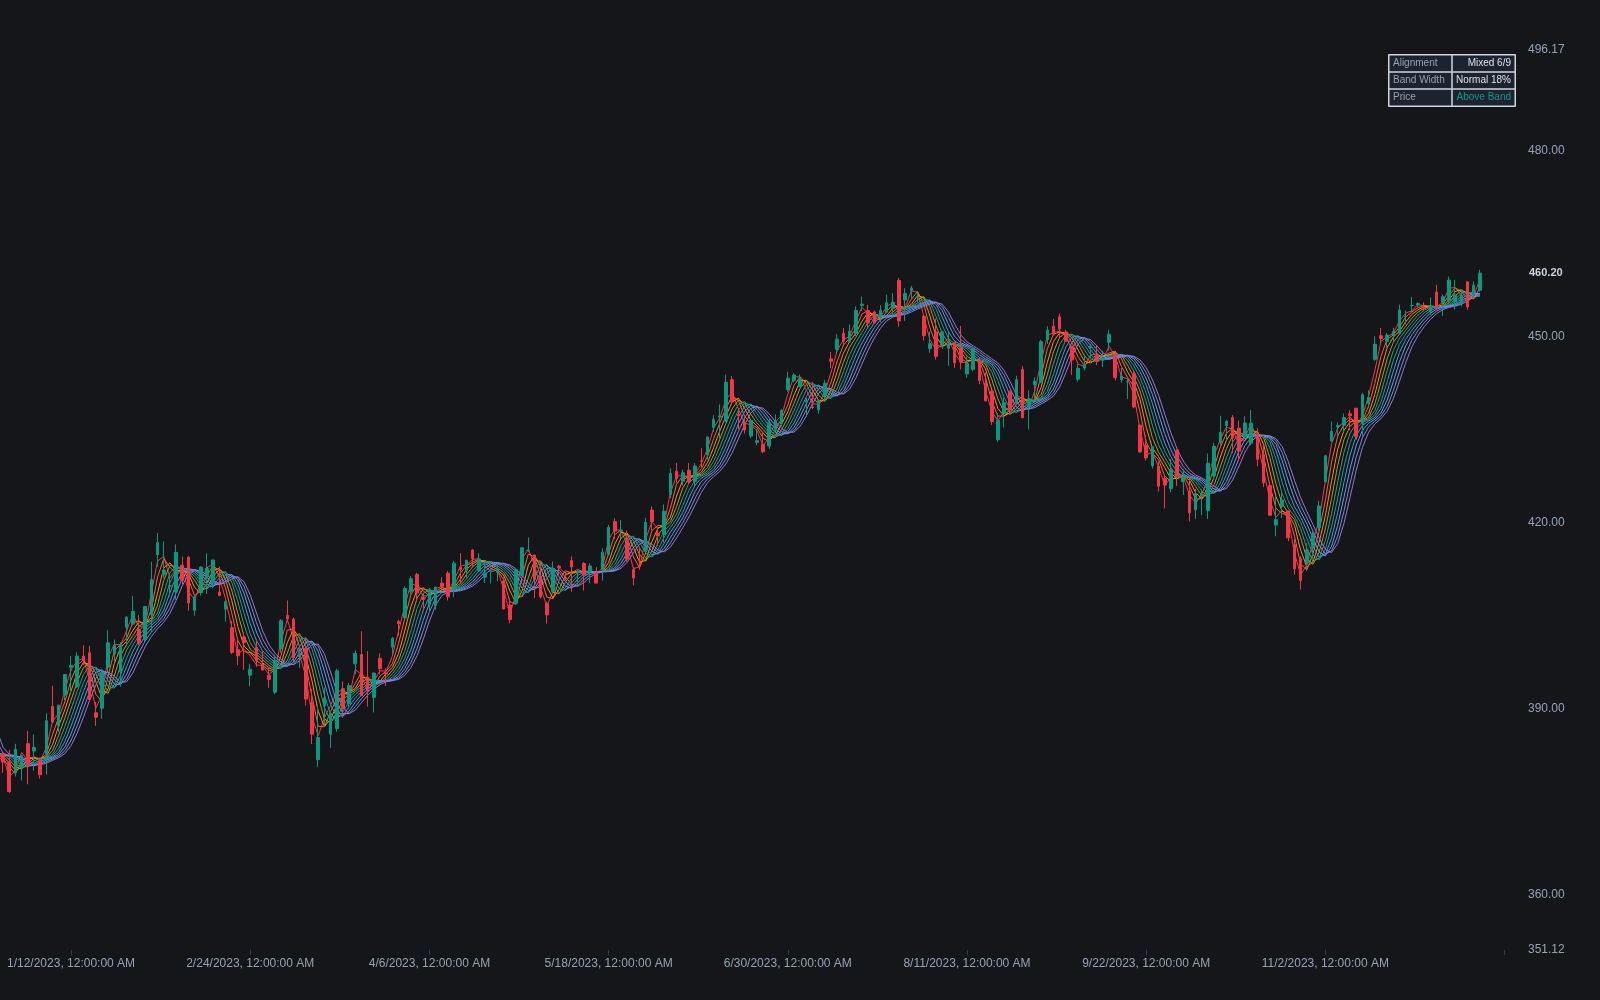
What is a Rainbow MA Stack?
A rainbow MA stack plots many moving averages at once, colored in a gradient so the group reads as a single band. Two constructions share the name: a set of averages with stepped lengths, for example ten SMAs from short to long, and Mel Widner's original 1997 Rainbow Charts, where a short average is smoothed again and again so each line is a two-period smoothing of the previous line. Either way, the information is in the band's geometry, not in any single line.
Widner introduced Rainbow Charts in the July 1997 issue of Technical Analysis of Stocks & Commodities, together with a companion rainbow oscillator scoring where price sits within the band and how wide it is. His construction starts from a two-period simple average of price and smooths it nine more times, so the inner lines hug price while the outer ones carry progressively longer effective lag. The name has since attached to any family of stepped-length averages, EMAs and VWMAs included, with Fibonacci-spaced length sets a popular variant.
The standard read: lines stacked in length order and fanning apart mark an established trend with agreement across horizons; lines compressing and braiding mark consolidation; price cutting into the band warns that the shortest horizons have already flipped. The logic is the same as an MA ribbon, and the two terms overlap heavily in practice, with rainbow usually implying more lines and a gradient palette.
One glance answers three questions single-average tools answer piecemeal: direction (the gradient's tilt), agreement (whether the lines are in length order), and conviction (how wide the fan is). The same information could be assembled from separate moving average crossovers and slope checks, but the stack shows it as texture. The cost is redundancy and lag: every line is computed from the same closes, so the stack can look unanimous because it is one signal drawn ten times, and the long end answers slowly.
How to identify a rainbow stack's regime on a chart
The read is geometric: line order, band width, and price's position relative to the band.
- 1Plot the stack, Widner's ten recursive smoothings or a set of stepped-length averages, colored in a gradient from shortest to longest.
- 2Check ordering: shortest lines nearest price with the rest in sequence below (uptrend) or above (downtrend) marks an aligned regime.
- 3Judge width: a fanning band shows horizons agreeing; a knotted band shows consolidation.
- 4Track price against the band: riding its upper edge, holding within it, or slicing through the full stack are three different messages.
- 5Watch the short end first; inner lines curling against the gradient are the earliest visible sign the alignment is ending.
How it's calculated
Ten recursively smoothed moving averages plotted as a fan; their ordering and spacing describe trend direction and strength.
The recursive SMA_2 construction is Mel Widner's Rainbow Charts (1997).
A common variant plots ordinary SMAs or EMAs of stepped lengths instead (for example 10 through 100) and reads the same ordering logic.
A widening spread indicates a strengthening trend; a compressed, interleaved fan indicates consolidation.
How traders use it
- As a visual regime gauge: fan width stands in for trend strength, compression for range conditions, and color-ordered stacking for alignment across lookbacks.
- As layered dynamic support and resistance: pullbacks that hold in the upper bands of a rising rainbow keep the trend read intact, while a decisive close through the whole stack is a common reversal warning.
- As a compression-breakout setup: when the entire stack knots together, the first sustained expansion out of the knot is followed directionally, similar in spirit to Guppy GMMA compression plays; a breakout through the stack's far side often anchors the entry.
- As a regime input for systems: line order and fan width quantify neatly (count of correctly ordered pairs, band width as a share of price), feeding a trend regime label or an MA slope filter.
- In an established rainbow trend, traders stalk pullback entries in the band's middle depths; a push to its far edge more often means the trend itself is failing.
Rainbow stacks vs other moving-average constructs
MA Ribbon: Mostly naming: ribbon usually means a handful of stepped-length averages, rainbow a larger gradient-colored set, with Widner's original build recursive rather than length-stepped. The reading conventions are identical.
MA Envelope: An envelope is one average shifted up and down by a fixed offset, so its width is a parameter. A rainbow's width is emergent, set by how much the underlying horizons disagree, exactly the information a fixed offset discards.
Supertrend: Supertrend collapses trend state into one flip-flopping line with a definite long-or-short answer. A rainbow refuses to give one, showing degrees of alignment instead; Supertrend suits rule-based execution while the stack suits regime assessment.
Concept family
Trend
100 concepts mapped · 100 in the Library
Rainbow MA Stack FAQ
Turn Rainbow MA Stack into a trading strategy.
Take the implementation from this page into Quant, then build on it, backtest it on real data, and keep refining it in conversation.