RSI Bands
 By LuxAlgoMar 15, 2026
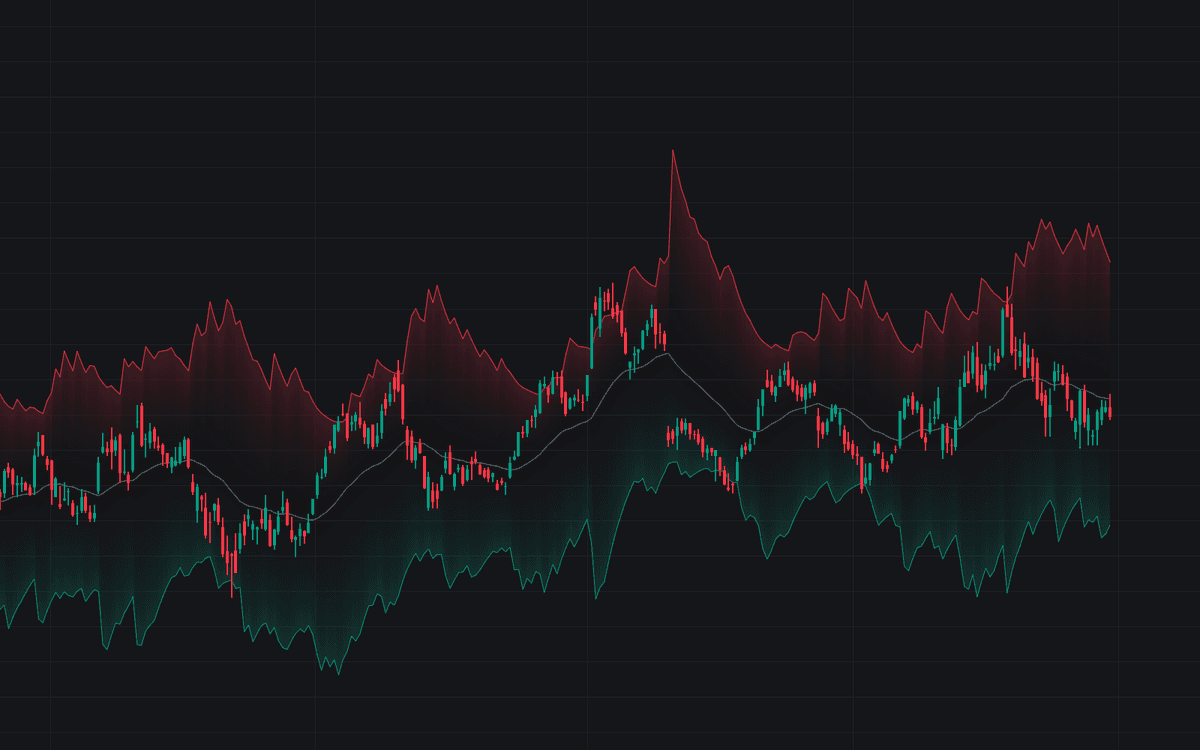

RSI Bands turns RSI thresholds into chart levels: each bar it runs Wilder's arithmetic in reverse, recovering the price where RSI would sit at exactly 70, 30 or 50, and plots the three answers in the price pane as an upper band, a lower band and a midline. Wilder's smoothing is recursive, so the averages entering the current bar are already settled and price is the only unknown. This build of RSI Bands solves it exactly, always agreeing with a standard 14-period RSI on the same source.
How to Trade the RSI Bands?
- Band tags: price reaching a band is, by definition, RSI reaching the matching threshold, visible in advance, a natural place for alerts or resting orders.
- Midline: price holding above the 50 line keeps RSI in its bullish half, and holding below keeps it bearish, a trend divider drawn on the chart itself.
- Band width: the gradient-filled span is the ground price must cover before RSI hits an extreme. Wide bands demand a large move, tight ones tip on a small push.
Six alerts cover tags and releases of both bands plus midline crosses, and optional circles mark each tag.
RSI Bands Settings
- RSI Length (default 14): lookback the bands invert; the same smoothed gain and loss averages drive both the oscillator and the solved levels.
- Source (default close): series the RSI runs on and the space the bands are solved in.
- Overbought Level (default 70) and Oversold Level (default 30): thresholds solved into price: 80/20 yields stricter bands.
- RSI 50 Midline (default enabled): the solved trend divider.
- Gradient Fill (default enabled) and Band Tag Markers (default disabled); the three color inputs set each band and the midline.
Frequently Asked Questions

Original indicatorBuilt in-house by LuxAlgo
The Library is free. Quant makes it yours.
Pull any concept or indicator into Quant: rebuild it, retune it, or turn it into a backtested strategy of your own.