Concept
RSI Bands
RSI Bands are Momentum & Oscillators concepts. The Library holds 1 implementation, a working definition you can pull into Quant.
Top RSI Bands indicator
The top custom implementation, built on the original standard RSI Bands formula.
1 total
This RSI Bands implementation is strategy-ready: open it in Quant, set your rules, and it backtests automatically.
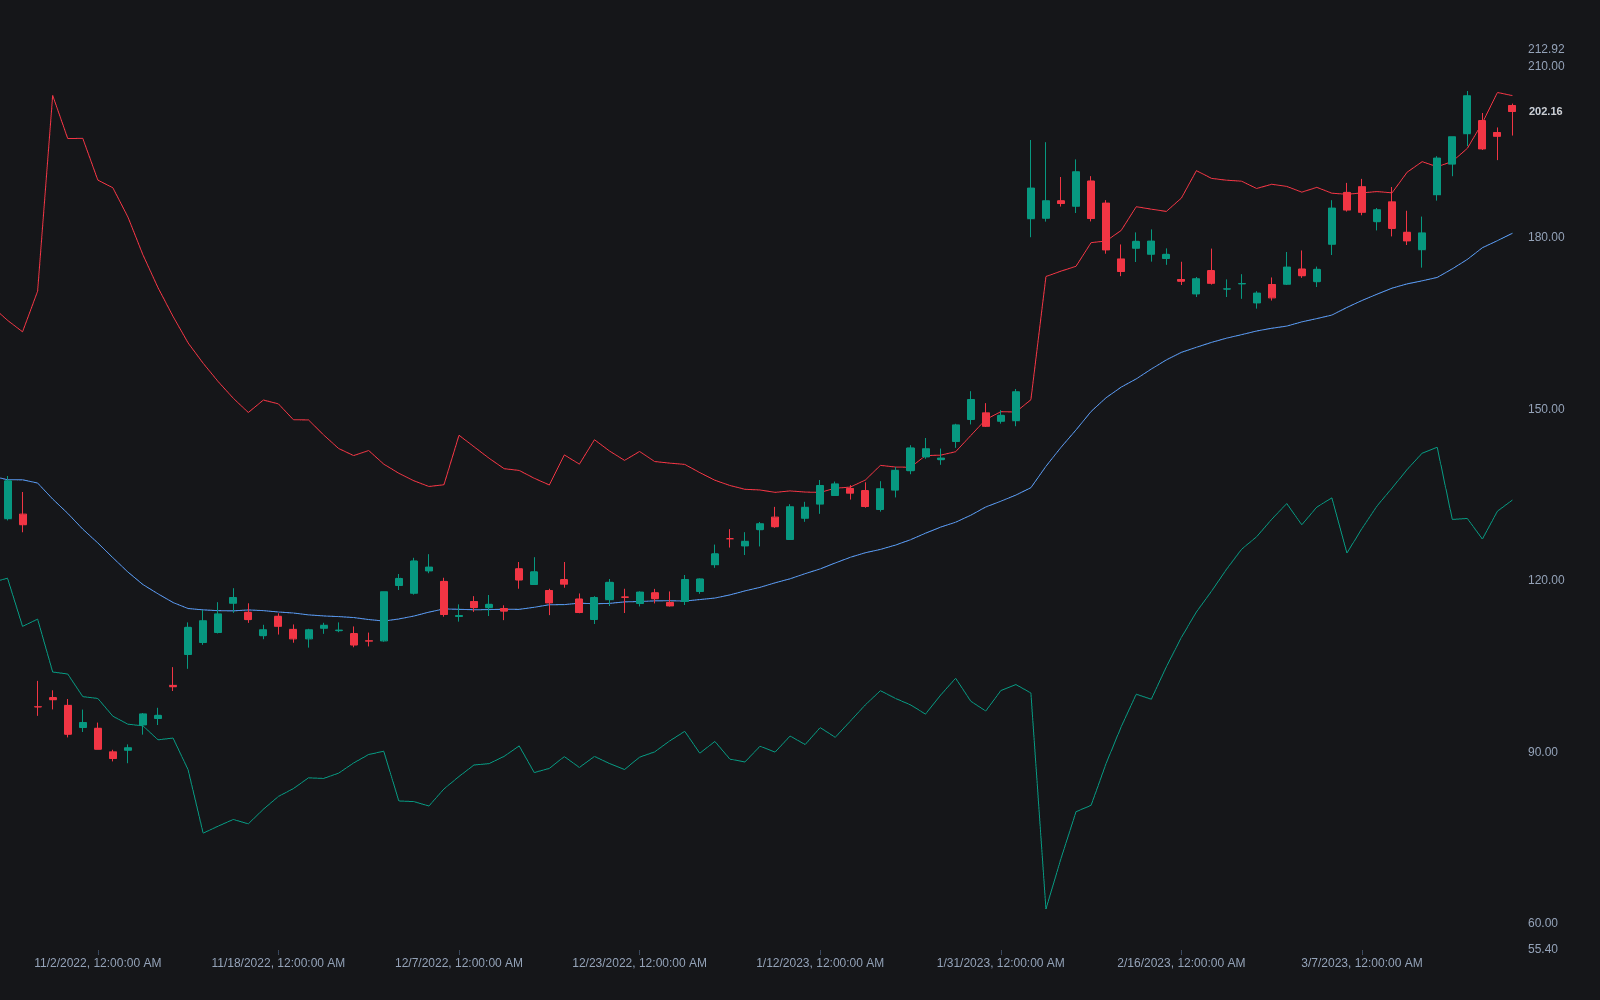
What are RSI Bands?
RSI Bands translate RSI thresholds into price. Instead of asking what RSI is at the current price, the construction solves Wilder's formula backward: given the smoothed gains and losses already on the books, what close would make RSI print exactly 70, or exactly 30, on this bar? Plotting those solved prices bar by bar draws two bands on the chart itself: an upper band marking the price at which RSI would reach the overbought threshold, and a lower band for the oversold one. Because Wilder's smoothing is recursive, the inversion is exact algebra, not an estimate.
The construction has a paper trail in Technical Analysis of Stocks & Commodities. Giorgos Siligardos' 'Reverse Engineering RSI' (2003) showed the formula could be solved for the close producing any target RSI value, and Francois Bertrand's 'RSI Bands' (2008) plotted the solved 70 and 30 levels as a continuous envelope. Public ports, most visibly LazyBear's TradingView version with its %B and bandwidth companions, carried the tool into mainstream charting.
The payoff is that threshold-watching moves from the oscillator pane to the price pane: you can see in advance where RSI would tip into an extreme, set alerts or resting orders there, and watch the bands widen or tighten as momentum conditions change. Derived measures treat the pair like any envelope: RSI %B locates price within the bands, RSI bandwidth measures their separation.
One naming caution: some sources use RSI Bands for a different tool, deviation bands drawn around the RSI line in its own pane to create moving thresholds, an approach that belongs with adaptive/dynamic RSI methods. The two share a name, not a construction; the pane usually settles it: price pane means inverted thresholds, oscillator pane adaptive bands.
How to identify RSI Bands on a chart
The name covers two different tools, so identification starts with which pane the bands occupy.
- 1Check the pane: true RSI Bands plot on the price chart, bracketing the candles; bands drawn inside the RSI pane are the adaptive-threshold variant.
- 2Verify the anchors: the upper band marks the price where RSI would print the overbought threshold (70 by default), the lower the oversold one (30); some versions add an RSI-50 midline.
- 3Watch the bands re-solve each bar: they drift with the smoothed gain-loss state rather than sitting at fixed offsets from price like a percentage envelope.
- 4Validate against a standard RSI pane: a close landing exactly on a band should coincide with RSI printing the matching threshold.
- 5Read the spread: wide bands mean price needs a large move to reach either extreme; tight bands mean a small push tips RSI into one.
How it's calculated
RSI Bands run the RSI formula backward to plot, on the price chart, the price levels at which RSI would sit exactly at chosen overbought and oversold values.
This is Giorgos Siligardos' reverse engineered RSI (2003); François Bertrand's RSI Bands (2008) plot it at the 70 and 30 levels.
Seed AUC and ADC with simple averages of the first n up and down moves, as in standard Wilder RSI.
A different construction that draws Bollinger Bands on the RSI line itself is also sometimes labeled RSI bands; it lives in the indicator panel, not on price.
How traders use it
- As pre-positioned levels: because the bands state the exact price at which RSI would hit 70 or 30, alerts and limit orders can rest at the level instead of reacting after the oscillator prints the extreme.
- As a dynamic envelope: in an uptrend, tags of the lower band mark pullbacks deep enough to push RSI to oversold, while persistent riding of the upper band reads as trend strength rather than an automatic fade.
- As compression analytics: narrowing RSI bandwidth means a small price move would swing RSI between extremes, a low-energy state that often precedes expansion without saying when or which way, while %B tracks where price sits in the meantime.
- As adaptive thresholds, in the second sense of the name: bands around the RSI line replace fixed 70/30 with levels drawn from RSI's own recent distribution, so overbought means unusually high for the current regime.
- As one input in a fade checklist: band tags are commonly qualified with a second condition, a regular bullish/bearish divergence on the oscillator pane or a nearby structural level, before a countertrend trade is taken.
RSI Bands vs similar constructions
RSI: The parent oscillator. RSI Bands are its inverse image: the same formula solved for price at fixed RSI values instead of for RSI at the current price.
Stochastic RSI: Derivations in opposite directions: Stochastic RSI re-scales RSI within its recent range into an even faster oscillator in its own pane, while RSI Bands leave the oscillator untouched and project its thresholds outward into price.
Adaptive/dynamic RSI: Both answer the complaint that fixed 70/30 lines ignore regime. Adaptive methods move the thresholds to fit recent behavior, the same instinct as range rules reading 40 to 80 as the uptrend zone; RSI Bands keep the thresholds and relocate them into price space, where they move with the market.
Concept family
Momentum & Oscillators
91 concepts mapped · 91 in the Library
RSI Bands FAQ
Turn RSI Bands into a trading strategy.
Take the implementation from this page into Quant, then build on it, backtest it on real data, and keep refining it in conversation.