Standardized Cumulative Deltas
 By LuxAlgoAug 27, 2025
Standardized Cumulative Deltas is an indicator on Vela, our next-generation charting platform, written in Pine Script®.
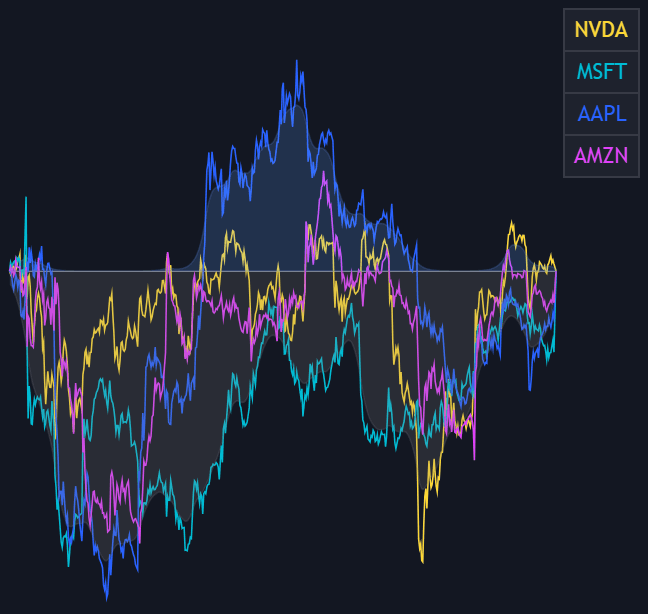
Standardized Cumulative Deltas reads sentiment across a whole basket instead of one chart. For up to ten tickers it accumulates each bar's open-to-close delta, a chart-based relative of cumulative volume delta, and standardizes each series so unrelated instruments share one pane. Lines above zero mark bullish pressure; clustering below zero marks seller control. Density areas summarize the group's lean at a glance.
How to Trade the Standardized Cumulative Deltas?
- Most lines above zero: broad bullish sentiment: most cumulative deltas are positive over the lookback.
- Cluster below zero: sellers dominate the group, better for timing basket exposure than single entries.
- Density Mode — Average: the areas show the group's mean positive and negative deltas, how consistent sentiment is across members.
- Density Mode — Envelope: the areas trace extremes instead, spotlighting volatility and outlier moves inside the basket.
- Dashboard: pairs each active ticker with its color so individual contributions stay identifiable.
Lookback defaults to Auto, using every visible bar, or can be fixed (500 bars, say) so comparisons stay constant as you scroll. Densities are smoothed with a forward-backward EMA: cleaner envelopes, with the caveat that this smoothing method can repaint.
Standardized Cumulative Deltas Settings
- Lookback: Auto (all visible bars) or a fixed bar count for consistent studies.
- Tickers: up to 10 symbols, each with its own toggle and color.
- Density Mode: Average for group-mean densities, Envelope for extreme-value densities.
- Show Dashboard with Position & Size: the ticker legend and its placement.
- Density, bullish/bearish colors, and Smoothing: area visibility, palette, and EMA smoothing strength.
Frequently Asked Questions
Free to use
Run it on Vela. Go further with a paid plan.
- Up to 500 strategy alerts, with webhook automation
- Up to 10× the chart history of Free
- Orderflow lookback up to full history
- More Quant usage to customize it, plus extra usage when you need it
- Futures data alongside crypto, stocks, forex and commodities
Also works on

Related indicators
.png&w=3840&q=75)
.png&w=3840&q=75)
Run it on Vela. Make it yours with Quant.
Open this indicator free on Vela, our next-generation charting platform. Then ask Quant, our coding agent built into Vela, to retune it or turn it into a backtested strategy of your own.