Concept
Z-score
Z-score, also known as rolling z-score, is a Statistics concept. The Library holds 1 implementation, a working definition you can pull into Quant.
Top Z-score indicator
The top custom implementation, built on the original standard Z-score formula.
1 total
From studying Z-score to trading it: take the implementation below into Quant and backtest it instantly.
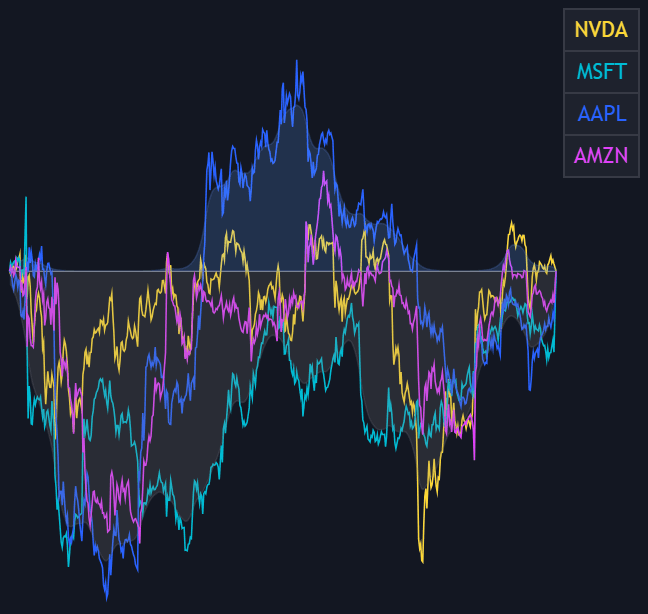
What is a Z-score?
A z-score expresses how far the current value of a series sits from its recent average, measured in standard deviations. A rolling implementation takes the last N values of any input (price, returns, volume, an oscillator, a spread), computes their mean and standard deviation, then divides the current value's deviation from that mean by the standard deviation. A reading of 0 sits exactly at the mean, +2 is two standard deviations above it, and negative readings mirror below.
The transform matters because it puts unrelated series on one unitless scale, which is the foundation of much mean-reversion and normalization logic: Bollinger Bands are simply the price levels where the z-score equals a chosen multiplier. The usual caution applies. The textbook intuition that roughly 95% of values stay inside ±2 assumes a normal distribution, and market returns are fat-tailed with a drifting mean, so extreme z-scores occur more often than the table suggests and can stay extreme while a trend runs.
How to calculate a Z-score
The rolling calculation needs only a window, a mean, and a standard deviation.
- 1Choose the input series and a lookback window N. Returns and oscillator values are better behaved than raw price, which trends and drags the mean along behind it.
- 2Compute the mean and the standard deviation of the last N values.
- 3Subtract the mean from the current value and divide the result by the standard deviation. The output is the distance from the window average, expressed in standard deviations.
- 4Plot it as an oscillator around zero, typically with reference lines at ±1, ±2, and ±3 marking increasingly rare readings.
How it's calculated
The number of standard deviations the latest value sits above or below its rolling mean.
Platforms split between population (divide by n) and sample (divide by n - 1) standard deviation; the gap shrinks as n grows.
A reading of +2 or -2 matches price touching a Bollinger Band of the same length and source with multiplier 2.
How traders use it
- As a mean-reversion trigger: readings beyond a threshold such as ±2 flag statistically stretched values, with entries taken back toward the mean. Thresholds are conventions rather than guarantees, and trending markets can hold a z-score pinned high or low for long stretches, which is why many systems pair the trigger with a trend filter.
- As a common scale for comparison: z-scoring lets momentum, stretch, or relative volume be ranked across different symbols and timeframes on equal footing, since every input becomes 'standard deviations from its own norm'.
- As the engine of spread trading: pairs models z-score the spread between two related instruments and trade its extremes, usually after a cointegration check confirms the spread actually reverts.
- As an outlier flag: a z-scored volume series is one standard way to define a volume spike, and the same treatment isolates unusually wide ranges or gaps.
Z-score vs related concepts
Percentile Rank: Percentile rank counts how many past values sit at or below the current one, using order alone. A z-score measures distance in standard deviations, so it preserves magnitudes but leans on the distribution being roughly normal; percentile rank makes no such assumption and saturates at the window's extremes.
Min-max Scaling: Min-max scaling positions the value between the window's minimum and maximum, so a single outlier stretches the scale and compresses everything else. A z-score is anchored to the mean and standard deviation, which dampens, though does not remove, the influence of one extreme print.
Bollinger Bands: The two are the same mathematics displayed differently: the bands draw the mean plus and minus k standard deviations on the price panel, while the z-score plots the equivalent position as an oscillator. A close on the upper band and a z-score of +k (same window and source) are identical statements.
Concept family
Statistics
46 concepts mapped · 46 in the Library
Z-score FAQ
Turn Z-score into a trading strategy.
Take the implementation from this page into Quant, then build on it, backtest it on real data, and keep refining it in conversation.