Concept
Delta Divergence
Delta Divergence is a Volume & Order Flow concept. The Library holds 1 implementation, a working definition you can pull into Quant.
Top Delta Divergence indicator
The top custom implementation, built on the original standard Delta Divergence formula.
1 total
This Delta Divergence implementation is strategy-ready: open it in Quant, set your rules, and it backtests automatically.
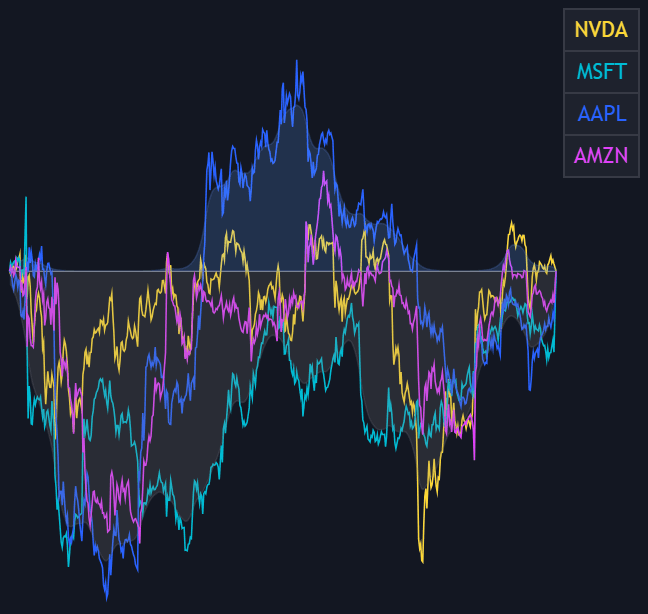
What is Delta Divergence?
Delta divergence is a disagreement between price and the aggression behind it. Volume delta nets ask-executed volume (market buys) against bid-executed volume (market sells) for each bar; cumulative volume delta (CVD) runs that total forward. When price prints a higher high but CVD prints a lower high, the second push carried less net buying: bearish delta divergence. A lower low in price against an equal or higher low in delta is the bullish mirror. Either way, price is moving without proportional aggressive participation.
Two mechanisms can produce it, and they mean different things. Aggression may simply be fading, with fewer market orders chasing each new extreme, or aggression may be arriving and getting absorbed by passive limit orders, which shows on footprint charts as heavy prints with little price progress. There is also a bar-level variant: a candle that closes up on negative delta, or down on positive delta. In every form it is a condition rather than a trigger; divergences can stack repeatedly while a trend keeps running, so most order-flow traders wait for structure to break before trading against the move.
How to identify Delta Divergence
You need a delta source first: per-bar volume delta, a CVD line, or a footprint. The comparison itself is the same swing logic used for oscillator divergence.
- 1Plot CVD (or per-bar delta) beneath price and note how it is anchored; a session-anchored CVD resets each day, so swings should only be compared within the same anchor period.
- 2Mark two successive swing highs on price in an advance, or two successive swing lows in a decline.
- 3Read the delta line at those same swings: a higher high in price with an equal or lower high in CVD is bearish delta divergence; a lower low in price with a higher low in CVD is bullish.
- 4Before acting, check the footprint for absorption at the extreme and wait for price structure to confirm with a break or failed retest; the divergence alone is not an entry.
How it's calculated
Flags bars or swings where a new price extreme or a directional close is not confirmed by net aggressive volume (delta).
Without exchange trade-side data, buy and sell volume are approximated with a tick rule or candle direction, so Delta is an estimate on most platforms.
Swing pivots are usually detected with a symmetric window, commonly 2 to 5 bars on each side.
CVD is the usual input for swing divergences; per-bar Delta drives the single-bar version.
How traders use it
- To qualify reversals at levels: a liquidity sweep of a prior high that prints on a lower CVD high suggests the push above the level was thin, a common precondition in fade setups, with the trigger still coming from price.
- To detect absorption: delta pressing hard in one direction while price stalls (the inverse mismatch) points to passive orders soaking up aggression, the order-flow expression of effort vs result.
- As a continuation filter: trend traders require new price extremes to come with new delta extremes and stand aside, or tighten risk, when the push is unconfirmed.
- At bar level on footprints: scalpers treat up-closes on negative delta near resistance, or down-closes on positive delta near support, as early evidence that the aggressive side is trapped.
Delta Divergence vs related concepts
Cumulative Volume Delta: CVD is the raw input: the running net of market buys and sells. Delta divergence is a pattern read on that line against price swings, not a separate calculation.
Volume Divergence: Volume divergence compares price with total, unsigned volume, so it measures participation. Delta divergence uses signed flow, so it measures which side was aggressive.
Regular Bullish/bearish Divergence: Oscillator divergence compares price with a transform of price itself, such as RSI or MACD. Delta divergence compares price with independent execution data, which is why order-flow traders treat it as a different class of evidence.
Concept family
Volume & Order Flow
88 concepts mapped · 88 in the Library
Delta Divergence FAQ
Turn Delta Divergence into a trading strategy.
Take the implementation from this page into Quant, then build on it, backtest it on real data, and keep refining it in conversation.