Concept
VIDYA
VIDYA, also known as variable index dynamic average, is a Trend concept. The Library holds 1 implementation, a working definition you can pull into Quant.
Chande
Top VIDYA indicator
The top custom implementation, built on the original standard VIDYA formula.
1 total
This VIDYA implementation is strategy-ready: open it in Quant, set your rules, and it backtests automatically.
What is VIDYA?
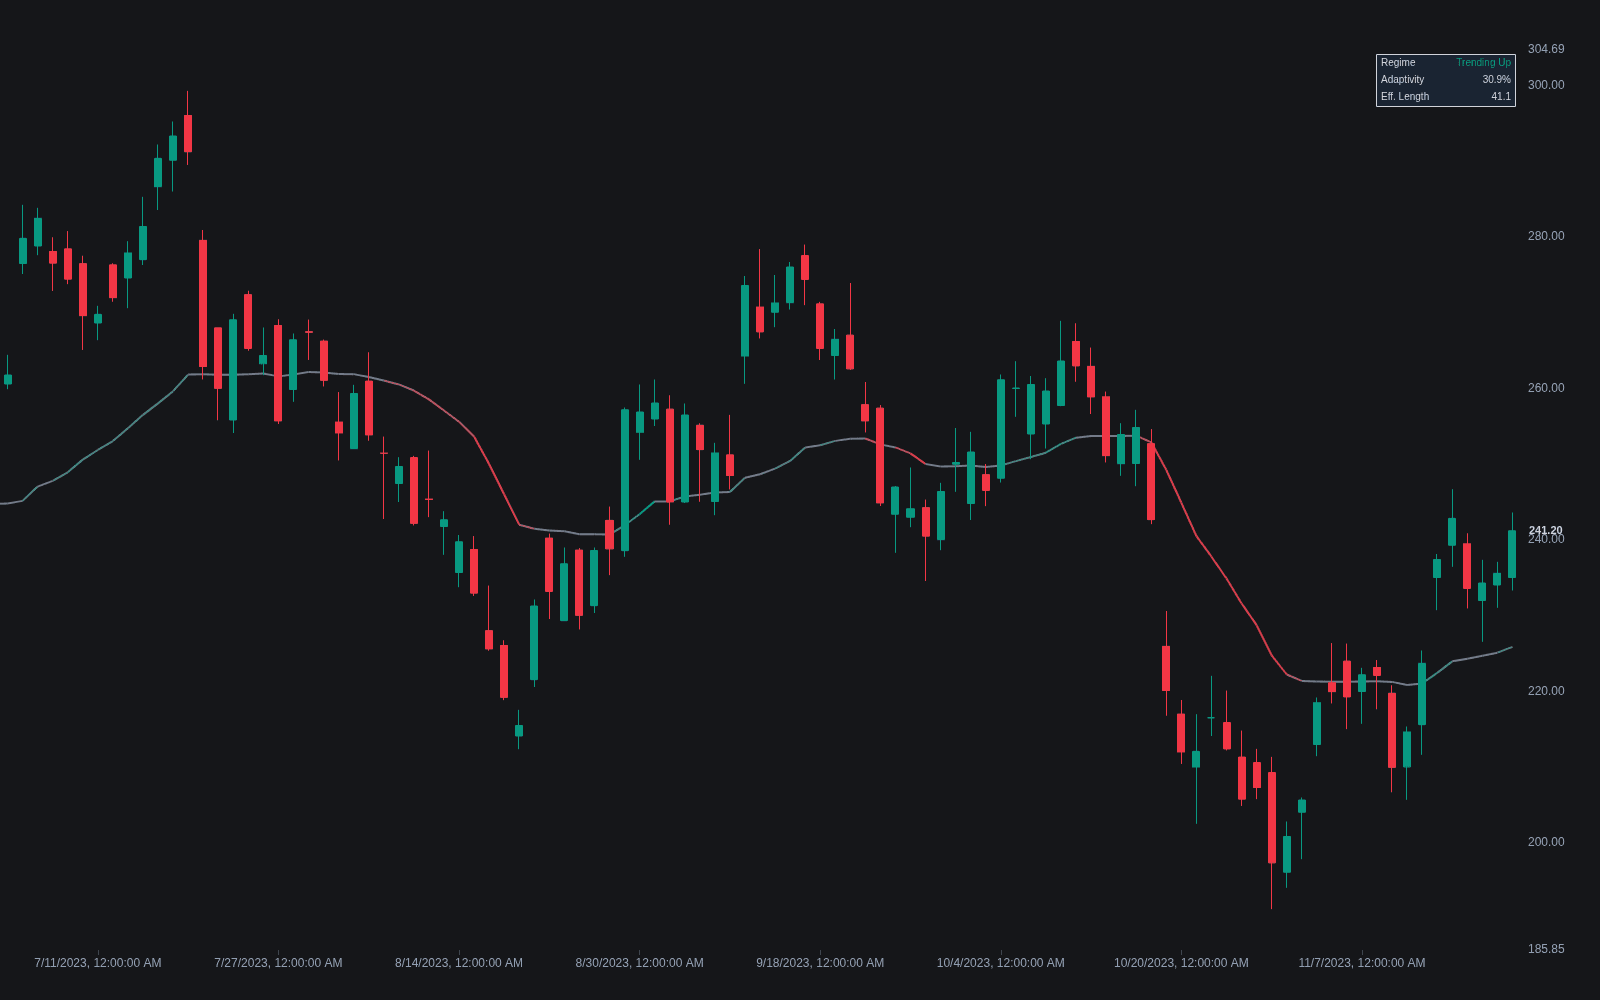
VIDYA (Variable Index Dynamic Average) is Tushar Chande's adaptive moving average: an EMA whose smoothing constant is rescaled every bar by how decisively price is moving. In the most widely used formulation the scaler is the absolute value of the Chande Momentum Oscillator (CMO), so strong one-sided momentum pushes the effective smoothing constant up and the average chases price, while balanced up-and-down movement pushes it toward zero and the average flattens. Chande's original version scaled by relative volatility, a ratio of recent to reference standard deviation, and both readings exist in the wild.
The effect is an average with a variable effective length. In a strong trend it behaves like a fast EMA; in congestion it goes nearly horizontal, which is exactly the property traders want from it: a line that stops following noise when there is nothing directional to follow. That behavior made it a common core for adaptive baselines and the trailing systems built on top of them. Adaptation reduces whipsaw in ranges; it does not eliminate it, and platforms that use different scalers will print different VIDYA values on the same chart.
Chande introduced VIDYA in a March 1992 Technical Analysis of Stocks & Commodities article, "Adapting Moving Averages to Market Volatility," and developed it further in The New Technical Trader (1994) with Stanley Kroll, where the momentum-scaled version took hold. It belongs to the era's wave of adaptive-filter research, alongside Perry Kaufman's KAMA and later John Ehlers' work, all attacking the same defect: a fixed-length average is tuned for one market condition and wrong everywhere else.
Within the moving-average family, VIDYA sits opposite the SMA, which weights every bar equally and reacts identically in trend and chop. Because its effective length floats, traders use VIDYA where a fixed average would need constant re-tuning: as dynamic support and resistance that hugs trends and detaches in ranges, or as the core of an MA envelope whose bands inherit its stall-and-chase behavior.
How to calculate VIDYA
The common CMO-based form takes a length N and a momentum lookback, frequently 9.
- 1Compute the base smoothing constant exactly as an EMA would: alpha = 2 / (N + 1).
- 2Compute the CMO over its lookback and take its absolute value divided by 100, giving a factor between 0 (movement fully balanced) and 1 (movement fully one-sided).
- 3Multiply the two: the effective smoothing constant for this bar is alpha × factor.
- 4Update recursively: VIDYA = effective alpha × price + (1 - effective alpha) × previous VIDYA. In the original variant, the CMO factor is replaced by a ratio of short-term to reference standard deviation.
How traders use it
- As a self-tightening trend baseline: a clearly sloped VIDYA marks a directional phase and a flat one marks congestion, a read some traders use directly as a trend regime filter.
- For price-cross and crossover signals, where the flattening behavior is intended to produce fewer triggers inside ranges than a fixed-length EMA; fewer, not zero.
- As the engine of trailing systems: bands or offsets around VIDYA follow price while momentum persists and stop migrating when it dies, which is why several trailing-stop designs are built on it.
- For breakout preparation: a VIDYA gone flat marks compression, and some traders arm entries when price leaves the flat line decisively, treating the first strong close away as the start of a directional phase.
- With slope rules: an MA slope filter turns the line into an explicit condition, taking signals only when VIDYA's slope exceeds a threshold in the trade's direction.
VIDYA vs other moving averages
EMA: An EMA weights new data with the same fixed constant on every bar regardless of conditions. VIDYA is the same recursion with the constant re-derived each bar, so it speeds up and slows down while an EMA cannot.
Ehlers SuperSmoother: The SuperSmoother is a fixed digital filter built to remove high-frequency noise with minimal lag; its response never changes with conditions. VIDYA achieves smoothness situationally, moving fast only when momentum says the movement is real.
Supertrend: Supertrend is a stepped ATR trailing line that flips between discrete bullish and bearish states, built for signals rather than smoothing. VIDYA is a continuous baseline; systems such as the Optimized Trend Tracker combine the two ideas by trailing offsets around a variable average.
Adaptive-lookback MA: An adaptive-lookback average changes how many bars it examines as conditions shift. VIDYA keeps its recursion and instead re-weights how much each new bar matters. Different mechanisms, similar intent.
Concept family
Trend
100 concepts mapped · 100 in the Library
VIDYA FAQ
Turn VIDYA into a trading strategy.
Take the implementation from this page into Quant, then build on it, backtest it on real data, and keep refining it in conversation.