Concept
Cost Sensitivity
Cost Sensitivity, also known as slippage, commission drag, is a Performance, Backtesting & Validation concept. The Library holds 1 implementation, a working definition you can pull into Quant.
Top Cost Sensitivity indicator
The top custom implementation, built on the original standard Cost Sensitivity formula.
1 total
From studying Cost Sensitivity to trading it: take the implementation below into Quant and backtest it instantly.
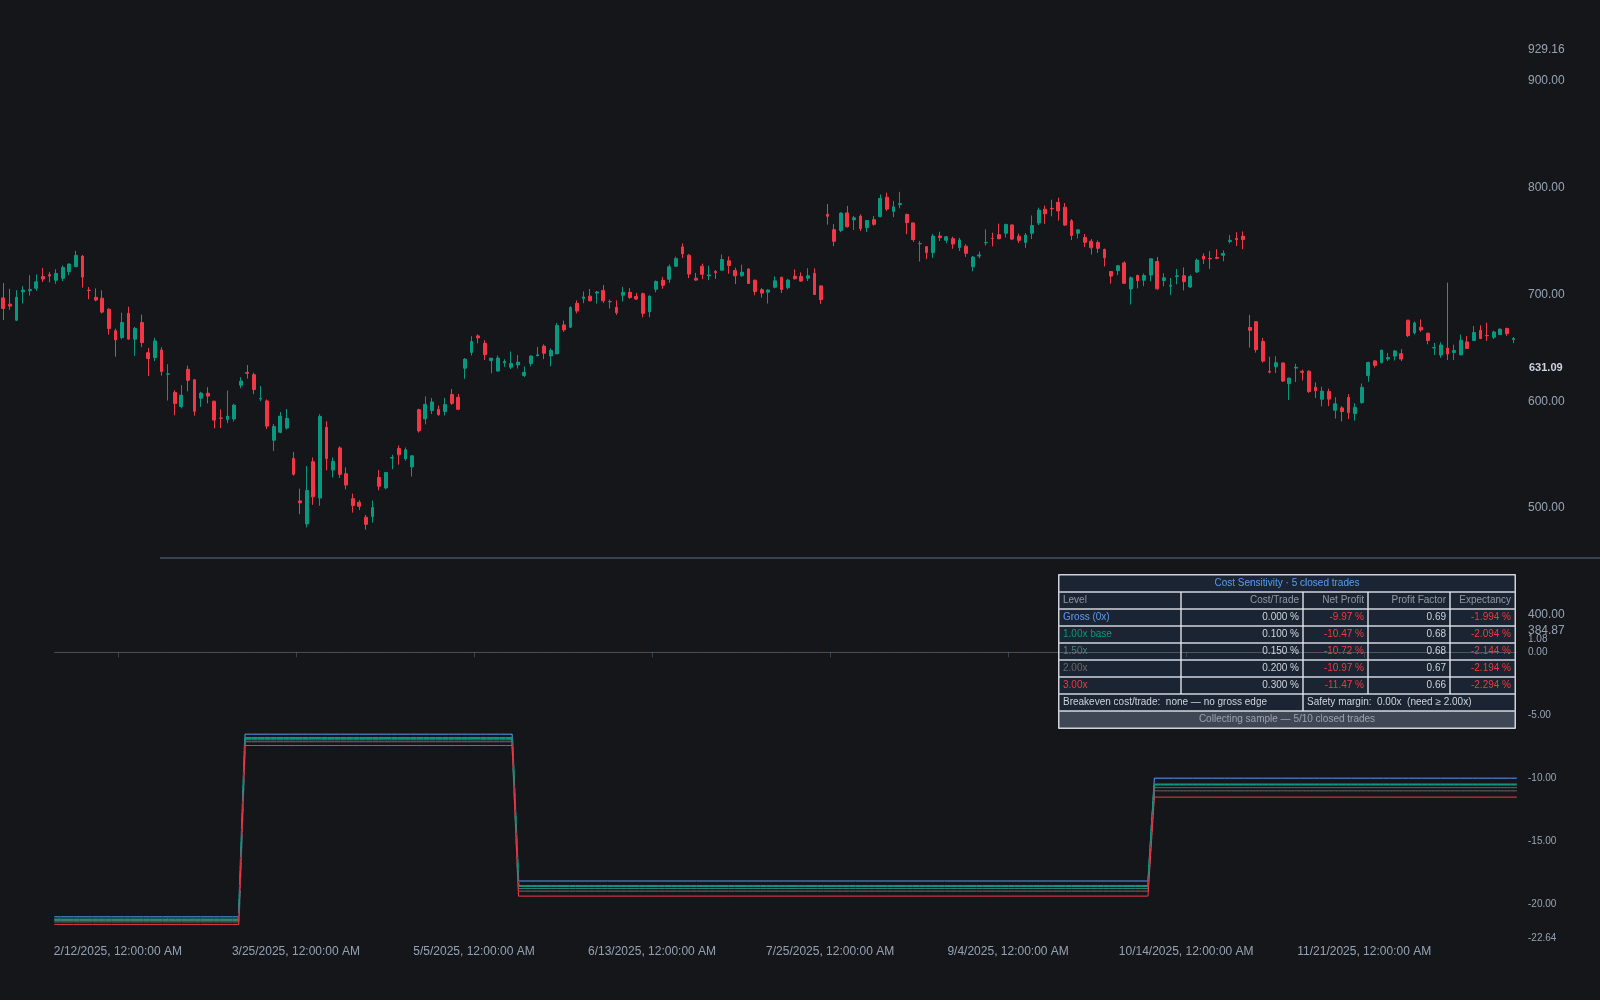
What is cost sensitivity?
Cost sensitivity is the practice of stress-testing a strategy's results against increasing levels of trading friction: commissions, spread, slippage, and fees. Instead of accepting the backtest's single cost assumption, the analyst re-runs or re-prices the trade list at progressively worse cost levels and watches how quickly the edge erodes. Traders also call this slippage sensitivity, and the cumulative effect of fees on results is often described as commission drag.
The exercise exists because costs are the most reliably underestimated line in a backtest. Fills in simulation are optimistic by construction, live spreads widen exactly when signals fire, and a strategy's gross edge per trade is often only a few multiples of realistic round-trip cost. A system whose profits vanish when slippage is doubled is not robust; it is an artifact of one flattering assumption. Cost sensitivity converts that hidden fragility into a visible curve.
The headline output is usually a breakeven cost: the per-trade friction at which expectancy reaches zero. Comparing that figure to honest live estimates gives a margin of safety. High-frequency systems are the most exposed, because cost is paid on every trade while edge per trade is small, which is why cost sensitivity is read alongside throughput stats such as trade frequency and turnover.
How traders use it
- As a sweep during validation: re-price the backtest at 1x, 1.5x, 2x, and 3x the assumed round-trip cost and plot net profit, profit factor, and expectancy against cost level. A steep curve is a warning even when the base case looks fine.
- To compute a breakeven cost per trade and compare it with measured live friction; many practitioners want live costs to sit well below breakeven, commonly by a factor of two or more, before allocating capital.
- To compare candidate strategies fairly: two systems with similar gross results can have very different cost robustness, and the one that survives pessimistic assumptions is usually the better live bet.
- As a design feedback loop, where excessive sensitivity pushes toward fewer, larger-edge trades, longer holding periods, or execution improvements, rather than toward more optimization of entries.
- With honest inputs: the sweep is only as good as the baseline model it multiplies, so it belongs alongside cost model realism work, not in place of it.
Cost sensitivity vs related concepts
Cost Model Realism: Cost model realism is about getting the baseline assumption right: what commissions, spread, and slippage actually cost for this instrument and size. Cost sensitivity takes that baseline and asks what happens as it degrades. One estimates; the other stress-tests.
Execution Cost Modeling: Execution cost modeling builds detailed models of how orders interact with the book, including market impact at size. Cost sensitivity is coarser: it perturbs an aggregate per-trade cost to map fragility, without modeling the microstructure.
Robustness Testing: Cost sensitivity is one axis of the broader robustness-testing program, which also perturbs parameters, data, and timing. A strategy should survive pessimism on all of these axes, not just costs.
Concept family
Performance, Backtesting & Validation
30 concepts mapped · 30 in the Library
Cost Sensitivity FAQ
Turn Cost Sensitivity into a trading strategy.
Take the implementation from this page into Quant, then build on it, backtest it on real data, and keep refining it in conversation.