Concept
Martin Ratio
Martin Ratio, also known as Ulcer Performance Index, return over Ulcer Index, is a Performance, Backtesting & Validation concept. The Library holds 1 implementation, a working definition you can pull into Quant.
Top Martin Ratio indicator
The top custom implementation, built on the original standard Martin Ratio formula.
1 total
This Martin Ratio implementation is strategy-ready: open it in Quant, set your rules, and it backtests automatically.
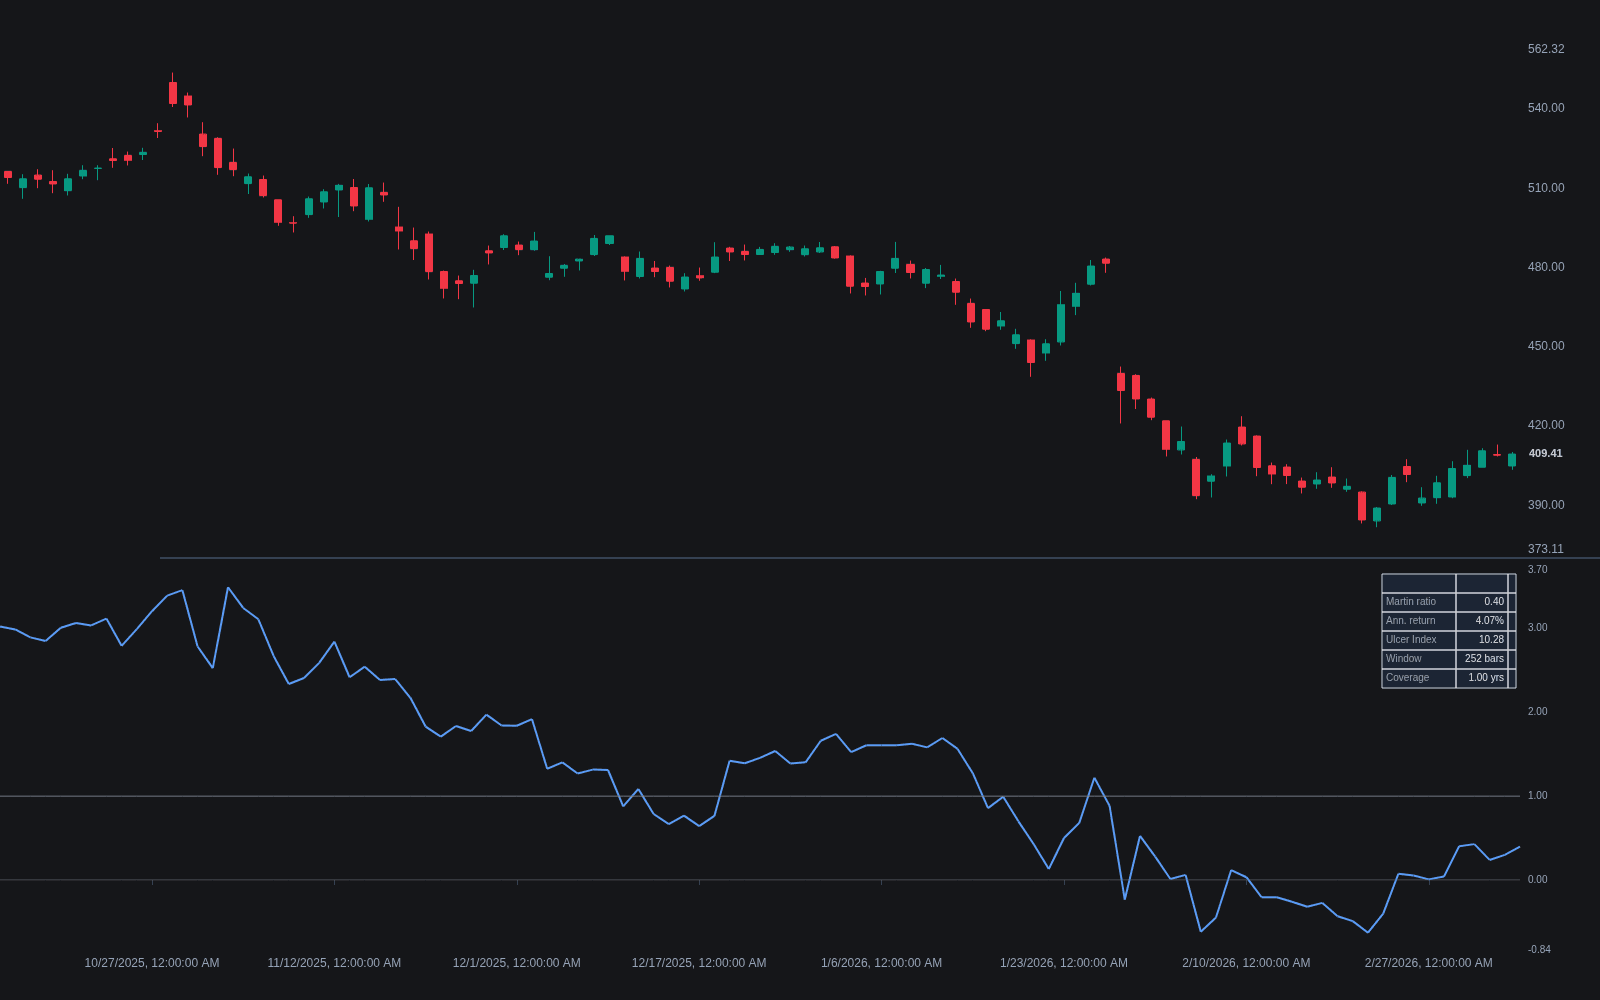
What is the Martin ratio?
The Martin ratio, also called the Ulcer Performance Index or return over Ulcer Index, is a risk-adjusted performance measure that divides a strategy's excess return by its Ulcer Index. The Ulcer Index, developed by Peter Martin and Byron McCann in the late 1980s, is the root-mean-square of the percentage drawdowns from the running equity peak, so it grows with both the depth and the duration of drawdowns. The ratio therefore scores growth per unit of sustained drawdown pain.
The measure exists to fix weaknesses on both sides of the usual trade-off. The Sharpe ratio penalizes upside volatility, which most traders do not consider risk, while the Calmar ratio hangs its entire risk estimate on the single worst drawdown, a noisy one-event statistic. By averaging squared drawdown depths across every bar of the test, the Martin ratio uses all of the downside information in the equity curve: a strategy that spends months underwater scores worse than one that dips briefly and recovers, even if their maximum drawdowns match.
Traders care because the denominator matches lived experience: time spent below the high-water mark is what erodes discipline and investor confidence. As a statistically fuller use of the drawdown record, many practitioners consider it one of the better single-number summaries for comparing systems, while acknowledging it remains backward looking like every performance ratio.
How it's calculated
The Martin ratio divides excess return by the root-mean-square drawdown of the equity curve.
The Ulcer Index depends on sampling frequency; daily equity marks are the common convention.
Squaring the drawdowns weights deep declines disproportionately, which is intentional.
How traders use it
- System comparison: when two strategies show similar returns, the higher Martin ratio identifies the one whose equity curve spent less time and depth underwater, often a better guide to tradability than Sharpe rankings.
- Fund and portfolio screening: the ratio is used to rank funds by growth per unit of drawdown stress, where it frequently reorders lists produced by volatility-based measures, especially for smooth-but-occasionally-gappy return profiles.
- Complementary reporting: because it aggregates all drawdowns while Calmar isolates the worst one, practitioners often report both, using disagreement between them as a prompt to inspect the full drawdown record.
- Limitations: the ratio is less familiar than Sharpe so comparisons across sources are harder, it is sensitive to the equity sampling frequency, and like all backward-looking ratios it can rank a strategy highly right up until its first genuinely deep drawdown.
Martin ratio vs. related concepts
Ulcer Index: The Ulcer Index is the risk measure itself, the root-mean-square drawdown. The Martin ratio is the performance measure built on it by dividing return by that index.
Calmar Ratio: Calmar divides return by the single maximum drawdown; Martin divides by an average over all drawdown depths and durations. Martin is statistically more stable, Calmar more sensitive to the one worst event.
Sortino Ratio: Sortino penalizes downside deviation of individual period returns below a target; Martin penalizes cumulative drawdown from equity peaks. A slow bleed of small losses hurts Martin more than Sortino.
Concept family
Performance, Backtesting & Validation
30 concepts mapped · 30 in the Library
Martin Ratio FAQ
Turn Martin Ratio into a trading strategy.
Take the implementation from this page into Quant, then build on it, backtest it on real data, and keep refining it in conversation.