Acceleration Bands
 By LuxAlgoApr 4, 2026
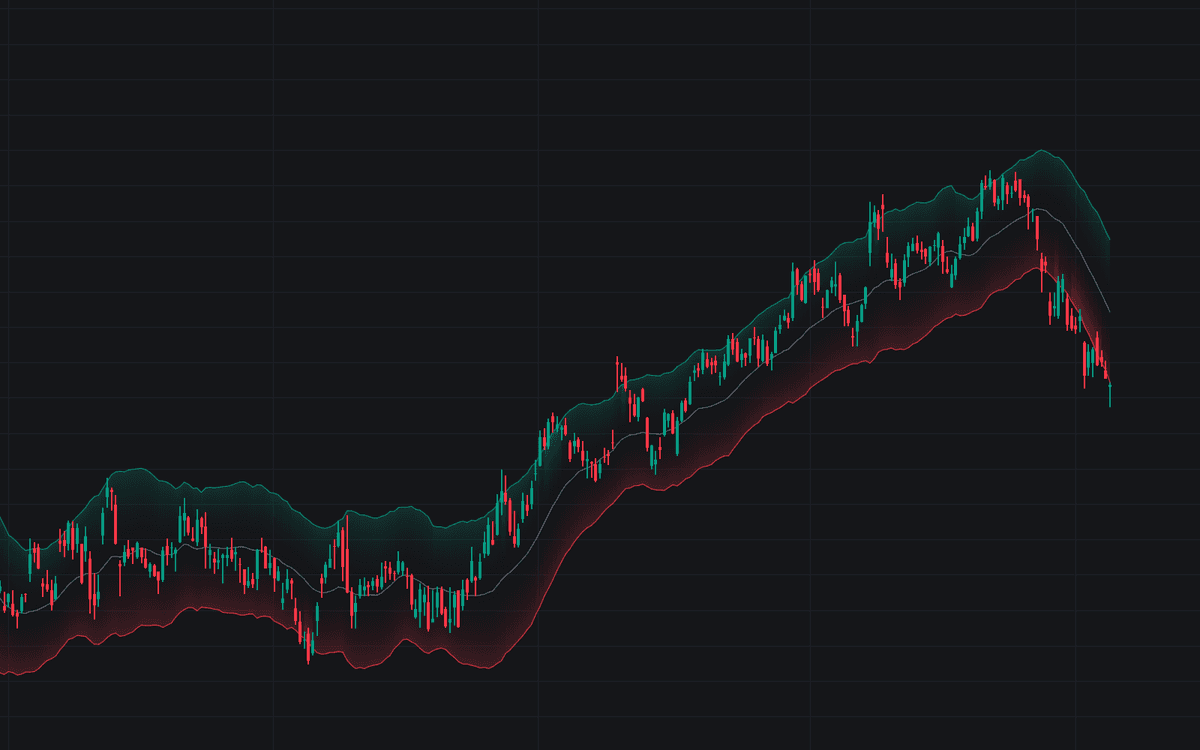

Acceleration Bands implements the published form of acceleration bands exactly: 20-period simple averages of range-adjusted highs and lows around an SMA midline, with each bar's normalized range scaled by a factor of 4 before averaging. A wide-ranging bar levers the bands apart at once, so expansion registers without a standard-deviation window.
On top of the bands, the build tracks the classic breakout rule as a state: two consecutive closes beyond a band start an acceleration phase, and the first close back inside ends it. That state drives optional entry and exit markers, an intensified gradient on the broken side, and matching alerts.
How to Trade the Acceleration Bands?
- Bullish Breakout: a triangle on the second consecutive close above the Upper Band, the classic acceleration entry.
- Bearish Breakout: the same rule below the Lower Band.
- Breakout Exit: a cross on the first close back inside the broken band, the standard exit.
- Midline crosses: alert-only events for earlier, noisier directional context.
Closes beyond these bands are read as strength worth joining rather than stretch worth fading, the opposite orientation of most band systems, and the reason the tool sits on the momentum side of the band and volatility toolkit.
Acceleration Bands Settings
- Length (default 20): lookback for all three simple moving averages; shorter windows track price more nervously.
- Band Factor (default 4): scaling applied to each bar's normalized range; in practice it governs how often closes land beyond a band.
- Show Breakout Markers (default off): draws the entry triangles and exit crosses; the alerts are available regardless.
- Style toggles cover the gradient fill and the acceleration-phase highlight, both on by default.
Frequently Asked Questions

The Library is free. Quant makes it yours.
Pull any concept or indicator into Quant: rebuild it, retune it, or turn it into a backtested strategy of your own.