Excess
 By LuxAlgoMay 8, 2026
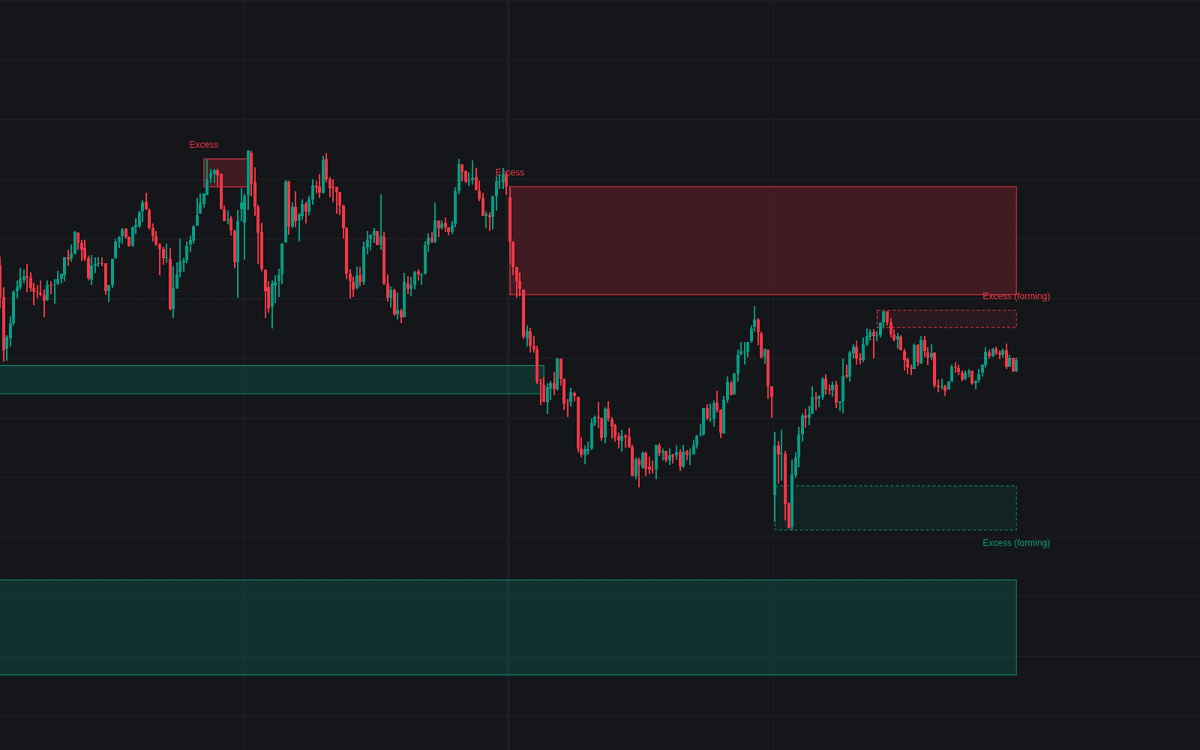

Excess extracts the rejected auction extremes that Market Profile treats as its most dependable references, straight from a TPO count. Each completed profile session is split into rows, TPOs are counted per row, and a run of consecutive single-print rows at the session high or low that meets the minimum qualifies as excess, drawn as a shaded tail zone with a label at the extreme. With extension on, every confirmed tail projects right as a working reference until initiative activity trades through it.
How to Trade the Excess?
- Excess high / excess low: a qualifying tail records decisive rejection, and the extreme carrying it is expected to hold on retest: resistance above, support below.
- Reference break: price trading through a stored extreme, by close or wick per the break basis, retires the reference and fires the matching alert.
- Developing excess: the dashed forming tail on the live session is provisional; prices revisited before the session completes stop being single prints.
Excess reads naturally alongside the library's other auction and profile tools.
Excess Settings
- Profile Session (default D): timeframe of the distribution inspected; the chart timeframe must be lower.
- TPO Period (default 30): duration of one TPO, the classic Market Profile convention.
- Profile Rows (default 25): rows the session range is divided into when counting TPOs.
- Minimum Tail Rows (default 2): consecutive single-print rows required at an extreme, the classic teaching threshold, since a one-period extreme may simply be the session's last print.
- Reference Break Basis (default Close): require a settle beyond the extreme, or any excursion with Wick.
- Extend References Until Broken, Show Developing Excess and Show Labels (all on).
Frequently Asked Questions

Original indicatorBuilt in-house by LuxAlgo
The Library is free. Quant makes it yours.
Pull any concept or indicator into Quant: rebuild it, retune it, or turn it into a backtested strategy of your own.