Balance vs Imbalance
 By LuxAlgoApr 2, 2026
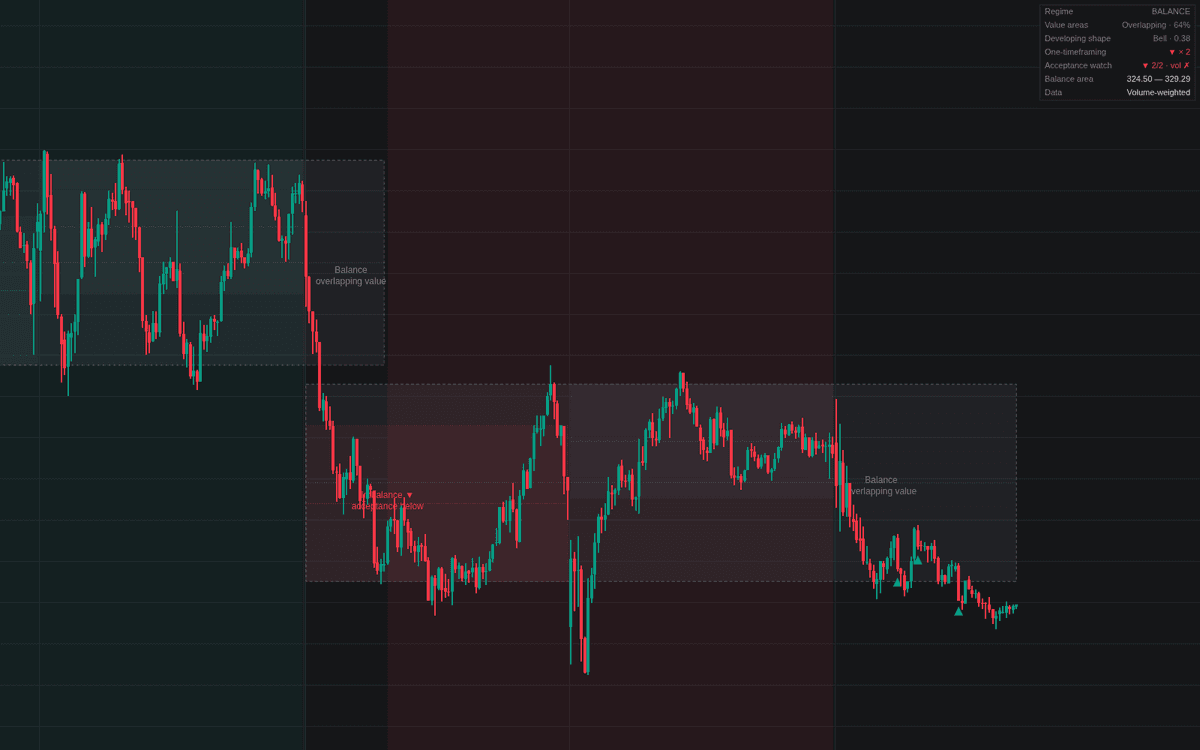

Balance vs Imbalance puts the balance vs imbalance regime read directly on the chart: every session builds its own profile, the active balance area is drawn as a box with a dotted rotation midline, and the regime flips to imbalance when value migrates or when enough period closes are accepted outside the area, optionally funded by above-baseline volume. Session value areas, a migration trail, probe markers, regime labels, and a dashboard complete the read.
How to Trade the Balance vs Imbalance?
- Balance regime: two-sided conditions favor rotation. Fade the box edges toward the dotted midline; edge tags carry alerts.
- Acceptance above/below: the required period closes outside the area (funded by volume when confirmation is on) flip the regime; trade with the break.
- Look Above & Fail / Look Below & Fail: a probe closed back inside before acceptance completed, the cue for rotation back toward the middle.
- Value Migration Trail: session value midpoints stepping one way trace a building imbalance.
Balance vs Imbalance Settings
- Session Timeframe (default D): the auction session each profile covers; keep it well above the chart timeframe.
- Profile Rows (default 24): bins per session profile.
- Value Area % (default 70): share of session volume in each value area.
- Overlap Threshold % (default 50): minimum value-area overlap to read as balance.
- Elongation Threshold (default 0.5): profile shape ratio separating bell from elongated.
- Acceptance Period (default 30) and Acceptance Periods (default 2): period timeframe and closes beyond an edge that confirm acceptance.
- Volume Confirmation (default on, Factor 1) with Volume Baseline Length (default 20): breaks must transact a multiple of average volume.
- Display toggles: balance areas, session value areas, trail, Sessions Shown (default 20), markers, labels, tint, dashboard.
Frequently Asked Questions

Original indicatorBuilt in-house by LuxAlgo
The Library is free. Quant makes it yours.
Pull any concept or indicator into Quant: rebuild it, retune it, or turn it into a backtested strategy of your own.