Projection Bands
 By LuxAlgoMay 3, 2026
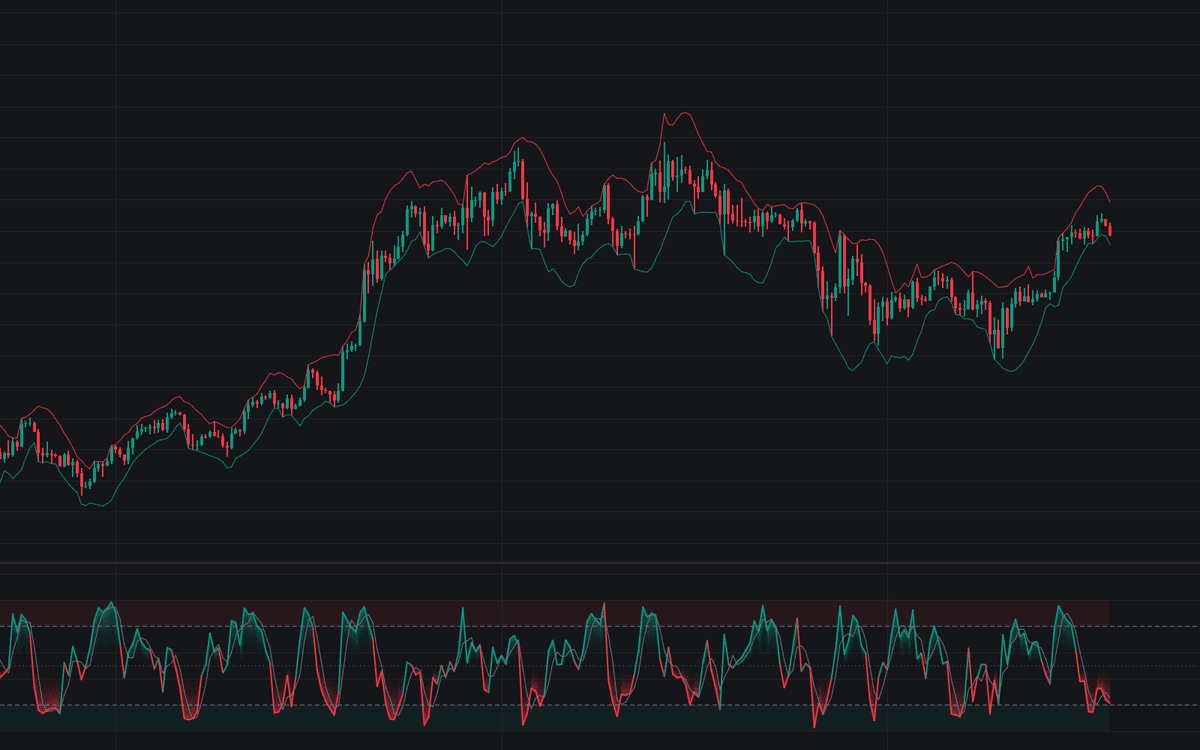

Projection Bands implements Mel Widner's slope-projected channel in its full three-part form, the first faithful build of projection bands in the library. Separate regression slopes are fitted to the window's highs and to its lows, every high and low is slid forward to the current bar along its own slope, and the extremes become the bands, drawn over price. Because each window bar is projected to the present, none can sit outside the channel, so this tool trades touches, not breaks.
How to Trade the Projection Bands?
- Band touch: price reaching the upper or lower band is pressing the boundary of its own trend-tilted channel. Both touches are alerted.
- Overbought and oversold entries: the Projection Oscillator crossing 80 or 20 marks an extreme relative to the trend, readable where a flat-range oscillator would sit pegged.
- Signal crosses: crossings of the short signal line time turns inside the channel. Both directions carry alerts.
- Divergences and bandwidth: regular divergences flag moves losing position inside their own channel; bandwidth crossings of its average mark compression and expansion.
Projection Bands Settings
- Length (default 14): the lookback window n.
- Show Bands on Price Chart (default on).
- Signal Length (default 3): SMA of the oscillator forming the signal line, with Show Signal Line (on).
- Overbought (default 80) and Oversold (default 20): the oscillator's extreme levels.
- Show Divergences (default off) with Pivot Length (default 5): the drawings; their alerts work regardless.
- Show Bandwidth (default off): plots 200 x (upper - lower) / (upper + lower) as a volatility gauge.
- Gradient Fill (on): shading from the 50 midline to the oscillator.
Frequently Asked Questions

Original indicatorBuilt in-house by LuxAlgo
The Library is free. Quant makes it yours.
Pull any concept or indicator into Quant: rebuild it, retune it, or turn it into a backtested strategy of your own.