Concept
Projection Bands
Projection Bands, also known as projection oscillator, Mel Widner, are Volatility concepts. The Library holds 1 implementation, a working definition you can pull into Quant.
Top Projection Bands indicator
The top custom implementation, built on the original standard Projection Bands formula.
1 total
The Projection Bands implementation below can become a backtested trading strategy — describe your rules and Quant writes the code.
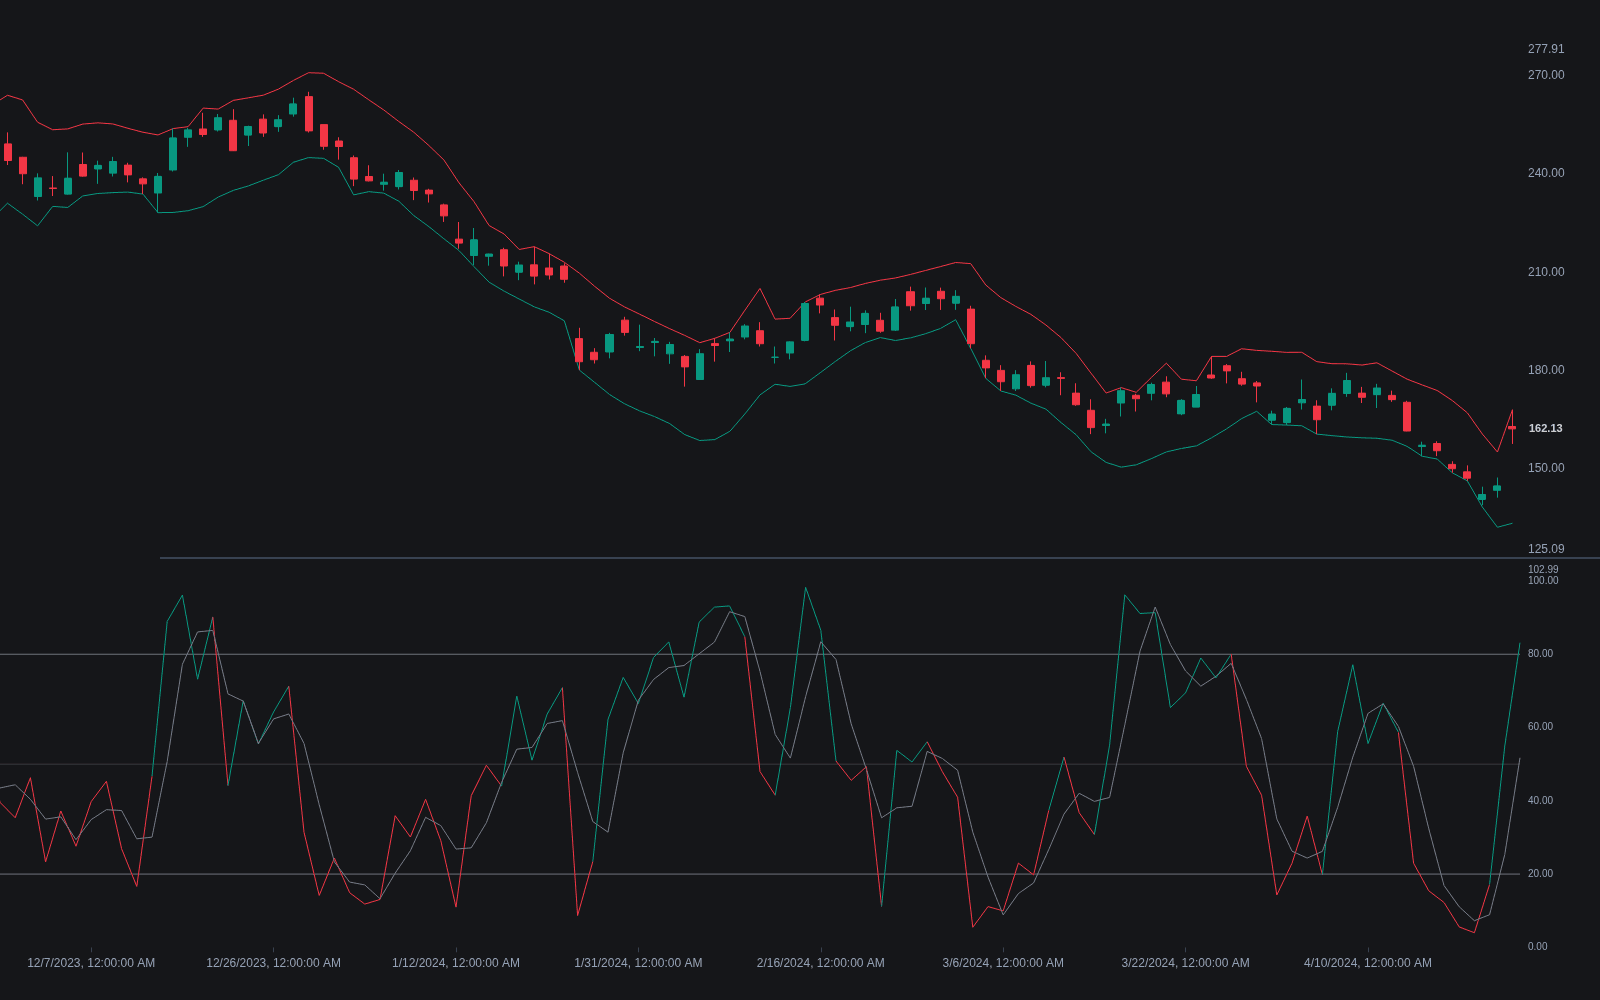
What are projection bands?
Projection bands are a channel introduced by Mel Widner in the mid-1990s that projects recent highs and lows forward along their own regression slopes. For each bar, the upper band is the highest value obtained by sliding every high of the lookback window forward along the slope of the highs, and the lower band is the lowest value obtained by sliding every low forward along the slope of the lows. The result is a channel that tilts with the trend and, by construction, always contains the price bars of the window.
Widner's motivation was a channel that adapts direction as well as width. Fixed envelopes and standard-deviation bands center on a lagging average, so in a strong trend price crowds one side. Because projection bands extrapolate the highs and lows along their fitted slopes, the channel leans into the move, and touches of either band remain meaningful in trends where a symmetric band would be pinned.
Two companions travel with the bands. The projection oscillator, the better known of the two, expresses the close's position inside the bands on a 0 to 100 scale, behaving like a slope-corrected stochastic oscillator. Projection bandwidth measures the spread between the bands as a volatility gauge. Traders care about the trio because they translate trend-adjusted extremes into bounded, comparable readings.
How it's calculated
Standard form over a lookback of n bars:
Because every high and low of the window is projected to the current bar, price within the window cannot lie outside the bands; the close can only reach a band, not exceed it on that bar.
The projection oscillator is often smoothed with a short moving average used as a signal line.
How traders use it
- Trend-following pullbacks: in an up-sloping channel, approaches to the lower band are treated as pullback entries in the trend's direction, with the band's slope doing the trend filtering.
- Bounded overbought/oversold: projection oscillator readings above roughly 80 or below 20 flag extremes relative to the tilted channel, which stays usable in trends where a raw stochastic sits pegged.
- Divergence reads: a new price high with a lower projection oscillator high suggests the advance is losing position within its own channel.
- Volatility context: narrowing projection bandwidth marks compression phases that often precede directional expansion, similar in spirit to a Bollinger squeeze.
- With honest limits: regression slopes over short windows are noisy, so the bands can swing their tilt abruptly after sharp bars, and the always-containing construction means band touches are frequent and need context.
Projection bands vs neighboring channels
Donchian Channels: Donchian Channels use the raw n-bar extremes with no slope adjustment, so they are flat between new extremes. Projection bands tilt the same extremes along their regression slopes.
Linear Regression Channel: A regression channel offsets one fitted line by a fixed or standard-deviation distance. Projection bands fit separate slopes to highs and lows and take projected extremes, so the two sides can diverge.
Bollinger Bands: Bollinger Bands center on a moving average with standard-deviation width, and price can close well outside them. Projection bands are extreme-based and contain the window's price action by construction.
Concept family
Volatility
57 concepts mapped · 57 in the Library
Projection Bands FAQ
Turn Projection Bands into a trading strategy.
Take the implementation from this page into Quant, then build on it, backtest it on real data, and keep refining it in conversation.