Concept
Beta
Beta is a Statistics concept. The Library holds 1 implementation, a working definition you can pull into Quant.
Top Beta indicator
The top custom implementation, built on the original standard Beta formula.
1 total
The Beta implementation below can become a backtested trading strategy — describe your rules and Quant writes the code.
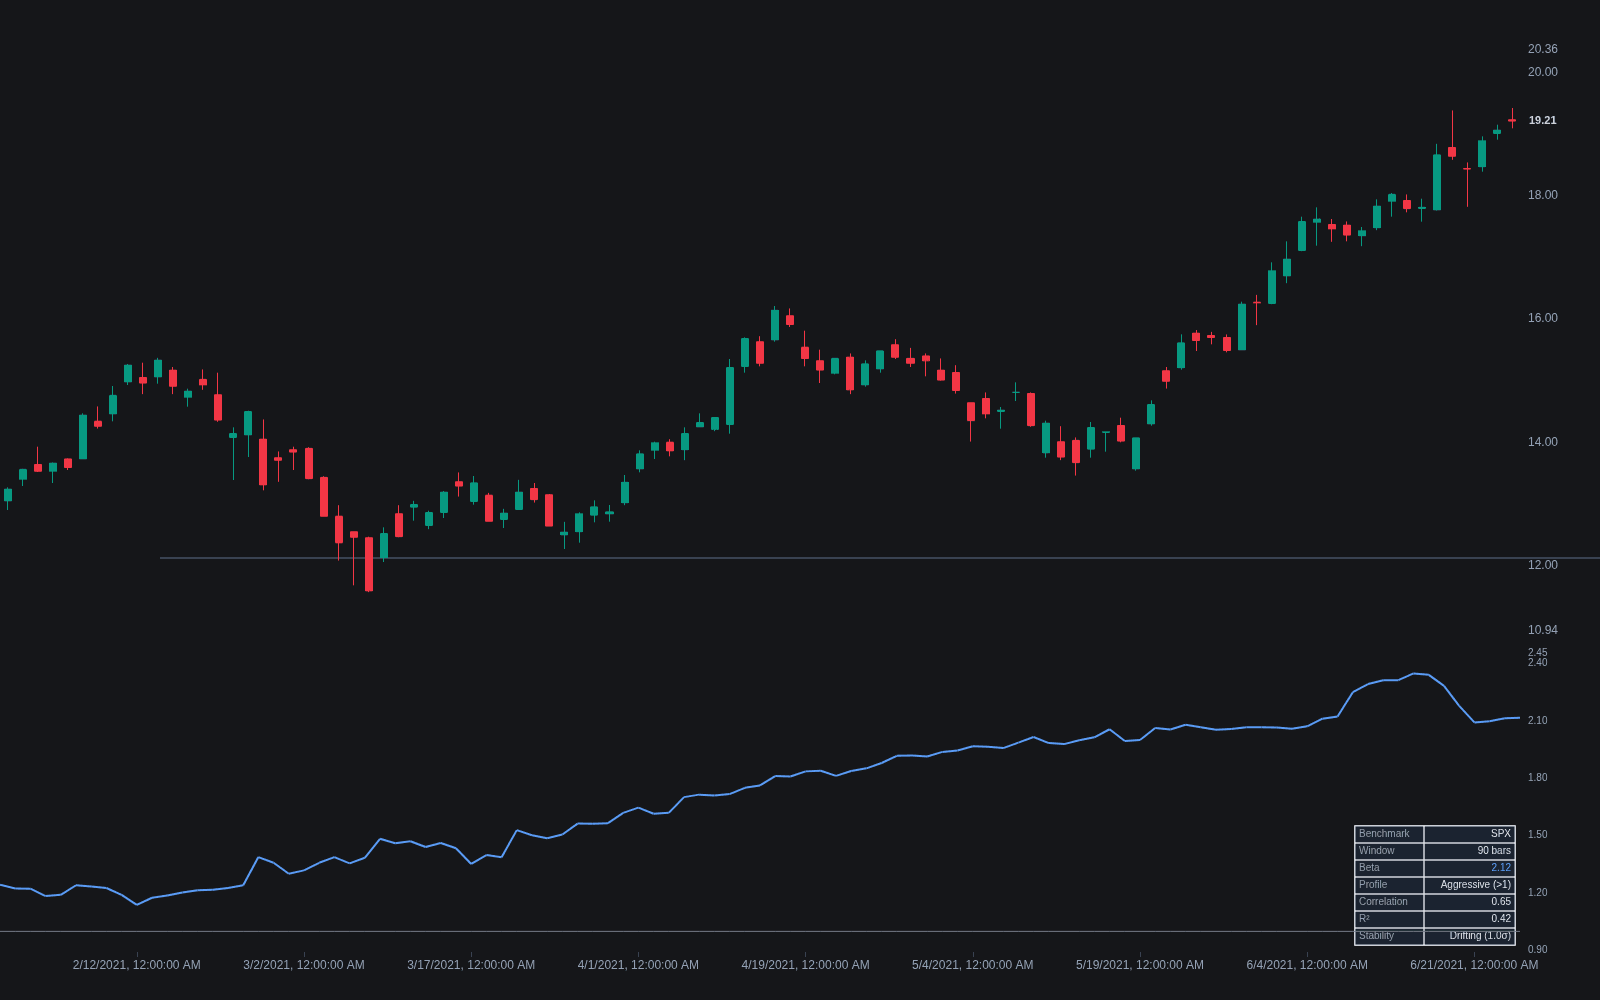
What is Beta?
Beta measures how strongly an asset's returns move with a benchmark's. Formally it is the covariance of the asset's returns with the benchmark's returns divided by the variance of the benchmark's returns, which is the same thing as the slope of a linear regression of asset returns on benchmark returns. A beta of 1 means the asset has historically moved in line with the index; above 1, amplified; between 0 and 1, damped; negative, tending to move opposite.
Beta and correlation answer different questions. Correlation says how reliably two series move together; beta says how much, because beta equals correlation multiplied by the ratio of the asset's volatility to the benchmark's. A volatile, loosely correlated asset can still print a large beta. And beta is a windowed estimate, not a fixed attribute: it drifts with regime, lookback, and return frequency.
Estimation choices shape the number more than most users appreciate. Convention in equity analytics runs from one to two years of daily returns up to five years of monthly ones, and the same stock can print materially different betas across those recipes. Refinements exist for the known failure modes: rolling windows expose drift, up-market and down-market betas estimated separately expose asymmetry that a single slope averages away, and shrinkage adjustments in the Blume tradition pull raw estimates toward 1 to counter the tendency of extreme betas to mean-revert. None of them fixes the underlying truth that beta is a description of a past window, applied forward on faith.
For traders the number is a workhorse with known limits. Screeners rank names by beta and alpha together, the paired outputs of one regression; crypto substitutes Bitcoin for the index and reads altcoin betas the same way; and portfolio bookkeeping nets position betas into one aggregate market sensitivity. The known limits: slopes estimated on calm windows understate crisis behavior, since co-movement strengthens in stress; a low R-squared makes the slope decorative; and fat-tailed return distributions let single days own the estimate, which is why regression diagnostics belong next to the number.
How to identify and estimate beta
Beta is one regression slope; the craft is in the recipe choices around it.
- 1Choose the benchmark deliberately: the index the strategy actually hedges with or compares against, not a default.
- 2Align the data: matching return frequencies and windows, with dividends and corporate actions handled consistently on both series.
- 3Regress asset returns on benchmark returns: the slope is beta, the intercept is alpha.
- 4Check the fit before trusting the slope: low correlation or R-squared means the beta describes little of the asset's movement.
- 5Roll the window and watch the drift: a beta that swings across subperiods is telling you the relationship is regime-dependent, which is information in itself.
How it's calculated
Beta measures how many units the asset's return moves per unit move in the benchmark's return over a chosen window.
Beta is the slope of the least-squares regression of asset returns on benchmark returns: 1 moves in line with the benchmark, above 1 amplifies its moves, below 1 dampens them, and negative values move opposite.
Population and sample divisors (n vs n - 1) cancel in the ratio, so both conventions give the same beta.
Log returns are an accepted alternative to the simple returns shown.
How traders use it
- Hedging and sizing: index hedges are scaled by beta so the hedge notional actually offsets the position's measured market sensitivity rather than its raw dollar size.
- Regime-fit screening: leaning into high-beta names when the index trend is the engine of the trade, rotating toward low-beta names when the goal is to mute index chop.
- Beta-adjusted performance reads: a stock up 1% while its index is up 2% is lagging once beta is accounted for; alpha is the formal name for what remains after that adjustment.
- Relative-value construction: long-short pairs are sized beta-neutral rather than dollar-neutral, so the spread expresses the relative view instead of a hidden market bet.
- Crypto positioning: altcoin betas against Bitcoin quantify amplification, informing rotation between majors and high-beta alts as conviction about the benchmark leg changes.
Beta vs. neighboring measures
Correlation: Correlation measures how reliably two return series move together, bounded between -1 and 1. Beta measures how much the asset moves per unit of benchmark move, scaling correlation by relative volatility. Tight correlation with small moves gives a low beta; loose correlation with violent moves can still produce a high one.
Alpha: Both come from the same return regression. Beta is the slope, the market-linked component of returns; alpha is the intercept, the residual return left after the beta-scaled market contribution is removed. Exposure versus excess.
Linear Regression: Beta is one application of the general machine: regress returns on returns and read the slope. Everything the statistics teach about regression, sensitivity to outliers, fit diagnostics, unstable slopes on short windows, applies verbatim to beta, and gets forgotten exactly as often.
Concept family
Statistics
46 concepts mapped · 46 in the Library
Beta FAQ
Turn Beta into a trading strategy.
Take the implementation from this page into Quant, then build on it, backtest it on real data, and keep refining it in conversation.