Concept
Resampling Tests
Resampling Tests, also known as bootstrap, permutation, are Statistics concepts. The Library holds 2 implementations, each one a working definition you can pull into Quant.
Top Resampling Tests indicators
The top custom implementations, built on the original standard Resampling Tests formula.
2 total
Want to trade Resampling Tests? Any of the 2 implementations below is one prompt away from a backtested strategy in Quant.
What are Resampling Tests?
Resampling tests estimate uncertainty by redrawing from the data you already have instead of assuming a theoretical distribution. The two workhorses are the bootstrap (Efron, 1979), which samples observations with replacement to approximate the sampling distribution of a statistic, and the permutation test, which reshuffles the order or labels of the data to build a null distribution in which any structure carried by ordering or labels has been destroyed. If the statistic computed on the real, ordered data sits far in the tail of the shuffled distribution, the structure is unlikely to be luck alone.
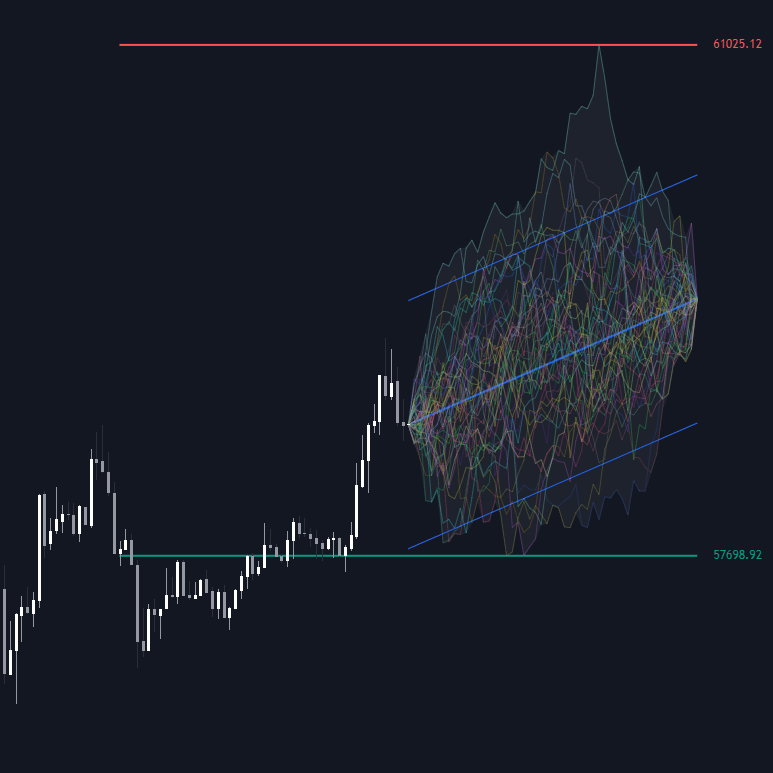
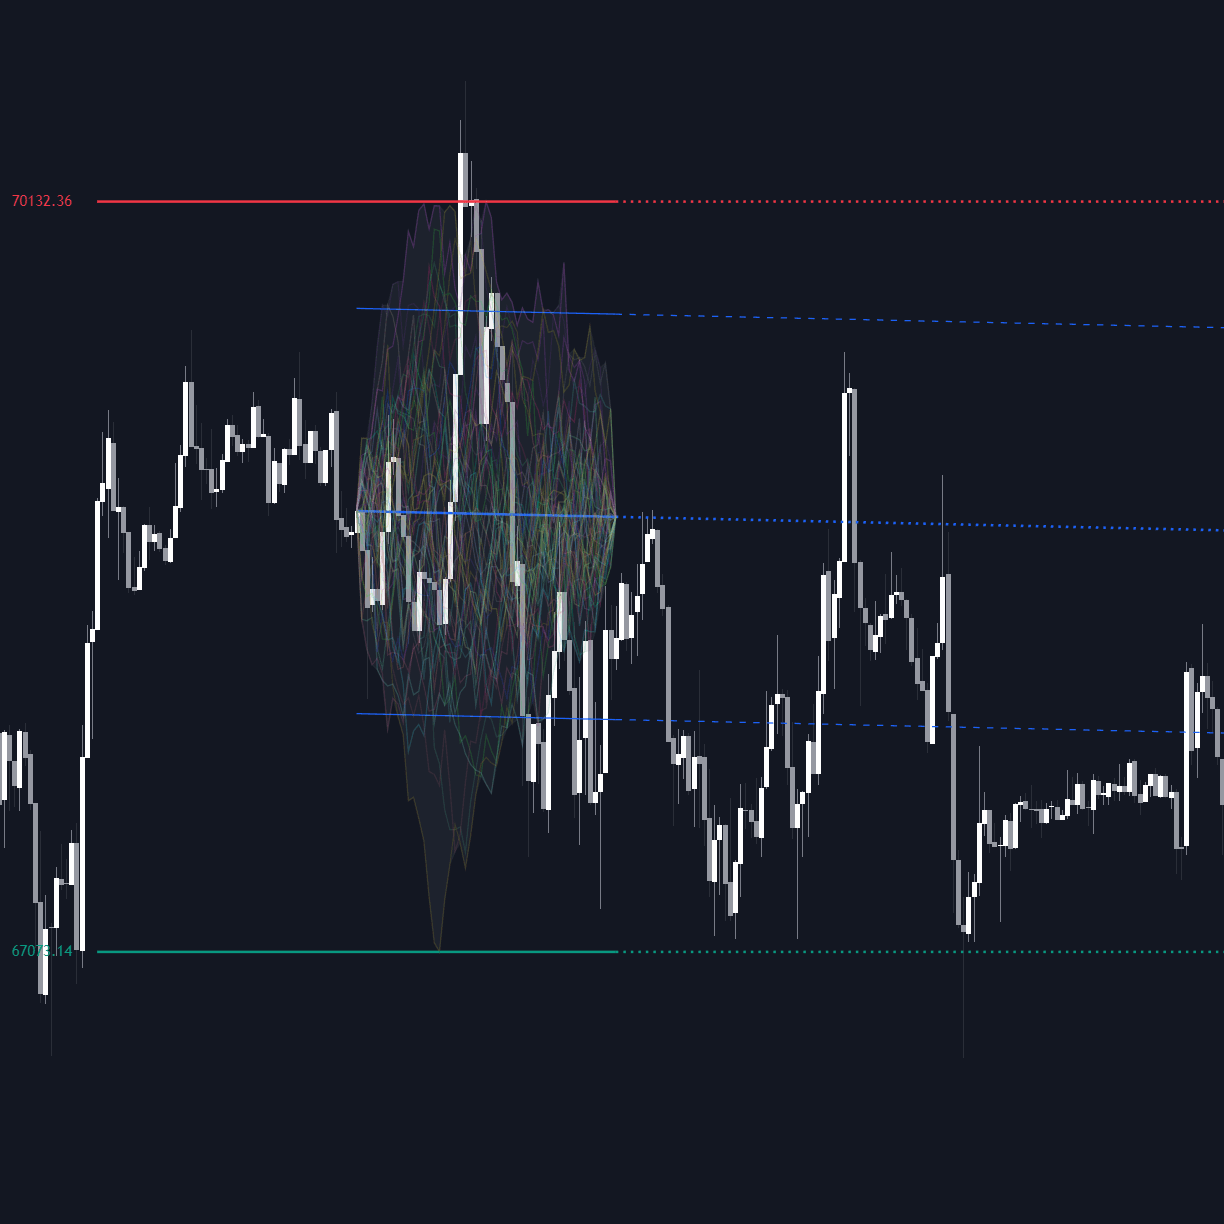
On charts the idea usually appears as shuffled-return projections: draw returns from a lookback window, chain them into many forward paths, and plot percentile bands of the outcomes, the same machinery behind Monte Carlo price paths and one common way of building probability cones. One caveat is structural: independent redraws erase autocorrelation and volatility clustering, so plain shuffles understate how losses and turbulence bunch together. Block bootstrapping (resampling contiguous chunks) preserves some of that memory, and no resampling scheme can represent regimes absent from the sampled window.
The refinements matter in markets precisely because returns have memory. Block bootstraps resample contiguous chunks so that autocorrelation and volatility clumping survive inside each block, with the stationary bootstrap randomizing block lengths to soften edge artifacts. Permutation logic extends beyond single strategies: reality-check style tests in the tradition of Halbert White's work resample the best result of many tried configurations, answering the question a lone backtest cannot, whether the best of dozens of variants beats what pure selection luck would produce.
The Library's implementations make the machinery visible: LuxAlgo's Monte Carlo Shuffled Projection resamples a window of past returns and fans the compounded paths forward as percentile envelopes, and the Anchored variant pins the simulation start to a chosen bar. Read them exactly as their construction implies: envelopes describing where price plausibly lands if the future keeps drawing from the sampled window's return distribution with no memory, useful for sizing and expectation-setting, silent about direction, and blind to any regime the window never contained.
How to run a resampling test
Every scheme follows the same loop: recompute the statistic on redrawn data many times, then see where reality sits in that distribution.
- 1Define the statistic first: terminal price, maximum drawdown, win rate, Sharpe ratio, whatever decision the test should inform.
- 2Choose the scheme to match the question: bootstrap with replacement for confidence intervals, permutation for significance against a no-structure null, block variants when serial memory matters.
- 3Redraw and recompute at high volume, typically thousands of iterations, recording the statistic each time.
- 4Locate reality in the redrawn distribution: the percentile of the actual result is the finding, whether read as an interval or a p-value analogue.
- 5Stress the scheme itself: vary the window, block length, and iteration count; conclusions that flip with the settings were artifacts of the settings.
How traders use it
- Projection envelopes: resample a window of past returns and compound them forward to draw percentile cones around price, read as scenario ranges consistent with recent behavior rather than forecasts.
- Backtest significance: permute entry signals (or shuffle returns) and re-run the strategy many times; an edge that random orderings reproduce easily is statistically indistinguishable from luck, a check that pairs naturally with an in-sample / out-of-sample split.
- Confidence intervals: bootstrap trade-level results to put empirical error bars on win rate, expectancy, or Sharpe ratio instead of quoting a single point estimate.
- Drawdown stress-testing: bootstrapping the order of a strategy's trades produces a distribution of maximum drawdowns, and sizing to survive a deep percentile of that distribution is more honest than sizing to the single historical worst case.
- Selection-bias control: when many parameter sets were tried, resampling the best-of-many under the null quantifies how good the winner should look by luck alone, deflating the data-snooping premium before any capital trusts it.
Resampling tests vs related uncertainty tools
Monte Carlo Price Paths: Monte Carlo simulation draws from an assumed model, often lognormal with estimated drift and volatility; resampling redraws the empirical returns themselves, keeping fat tails and skew the model would smooth away. One inherits its assumptions, the other inherits its window.
Probability Cones: Cones are the display: percentile envelopes widening with horizon. Resampling is one engine for building them empirically, the alternative being analytic volatility scaling. Same picture, different provenance, and the empirical version bends with the sampled distribution's asymmetry.
In-sample / Out-of-sample Split: The holdout split asks whether an edge generalizes across time; resampling asks whether the in-sample result exceeds luck at all. A strategy can pass either check and fail the other, so the two validations stack rather than substitute.
Concept family
Statistics
46 concepts mapped · 46 in the Library
Resampling Tests FAQ
Turn Resampling Tests into a trading strategy.
Take any implementation from this page into Quant, then build on it, backtest it on real data, and keep refining it in conversation.