Concept
Balance vs Imbalance
Balance vs Imbalance is a Volume & Order Flow concept. The Library holds 1 implementation, a working definition you can pull into Quant.
Top Balance vs Imbalance indicator
The top custom implementation, built on the original standard Balance vs Imbalance formula.
1 total
This Balance vs Imbalance implementation is strategy-ready: open it in Quant, set your rules, and it backtests automatically.
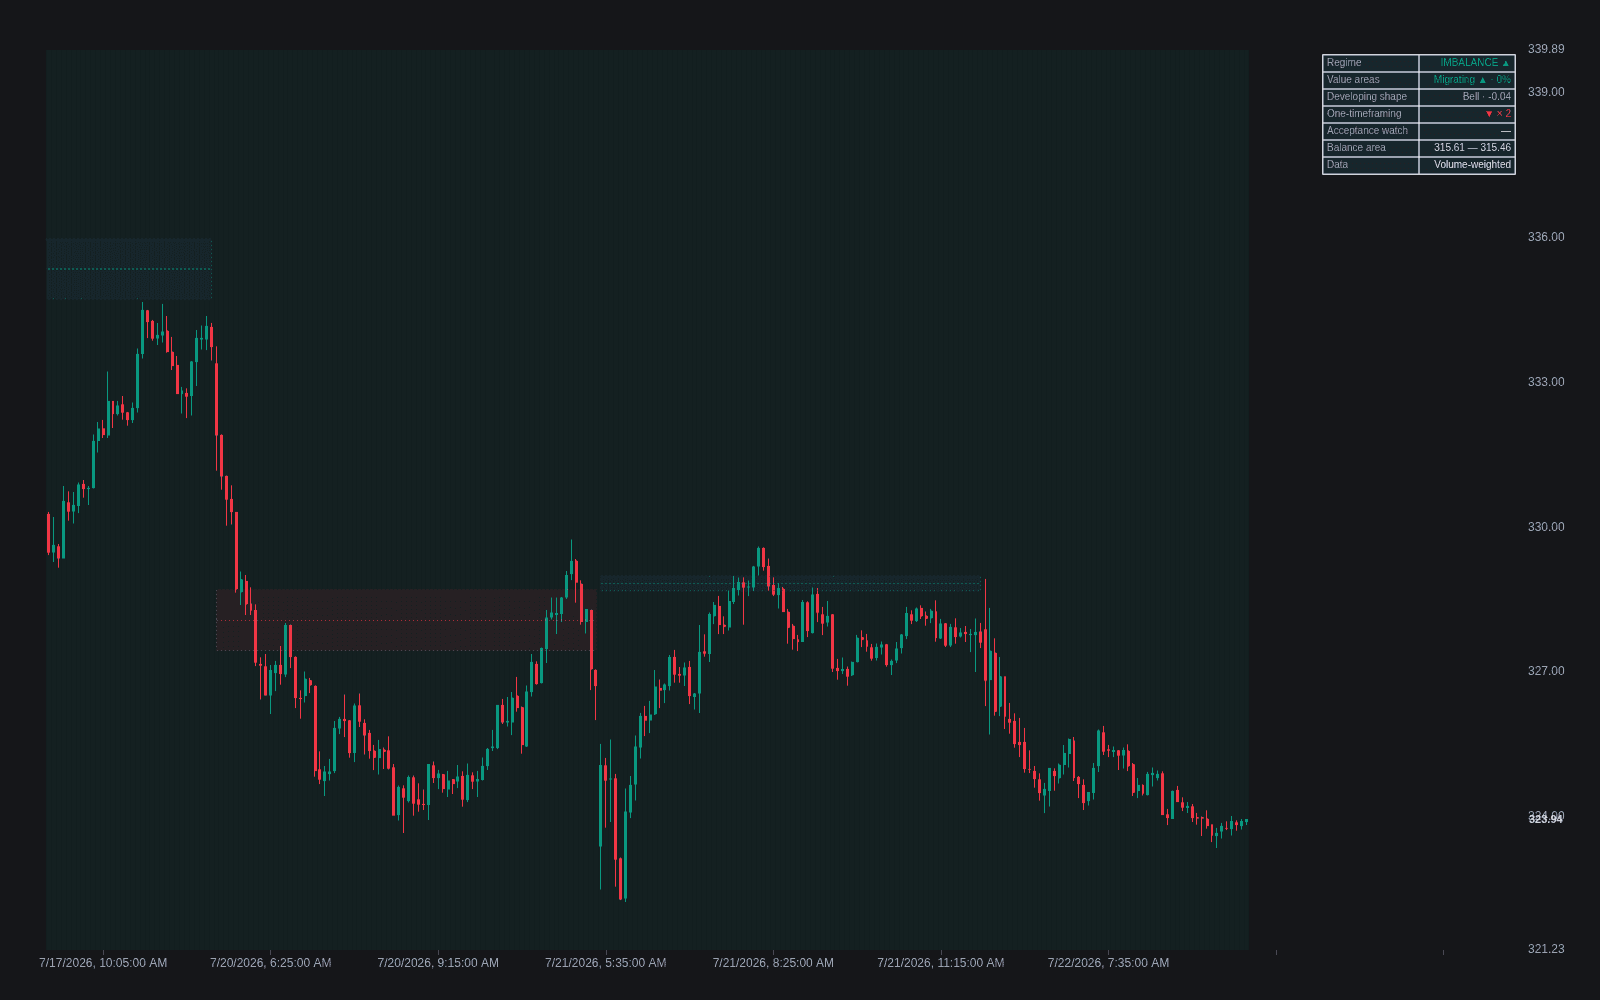
What is Balance vs Imbalance?
Balance vs imbalance is the core distinction of auction market theory, from the Market Profile tradition begun by J. Peter Steidlmayer. A balanced market is two-sided: buyers and sellers broadly agree on value, price rotates around it, and the profile fills into a rough bell with a defined value area. An imbalanced market is one-sided: one party is aggressive enough to move the auction directionally in search of new value, printing an elongated, thin profile and sustained one-timeframing.
The distinction is auction theory's regime layer, sitting above every setup: Steidlmayer's CBOT-era framework treated the market as an endless auction alternating between finding value (balance) and searching for it (imbalance), and the Dalton-tradition teaching built its playbooks on classifying that state first. The claim is practical rather than philosophical, since the profitable behaviors in the two states are near opposites.
Markets alternate between the two states, and the transitions are where most auction-theory setups live: acceptance outside a balance area marks imbalance beginning, while a probe that fails and returns marks balance continuing. Because the correct tactics are opposite in each state, classifying the state comes before choosing any setup.
Classification is done with the profile toolkit. Overlapping value areas across sessions, a rounded volume or TPO profile, and price crossing the point of control freely all say balance; elongated profiles, value migrating session over session, and one-timeframing say imbalance. Signed flow sharpens the read, since genuine imbalance shows directional volume delta behind the range extension, while a break on hollow delta warns the excursion may fail back into balance.
How to classify balance vs imbalance
The classification precedes the trade; every element is read from the developing and prior profiles.
- 1Lay recent sessions' profiles side by side: overlapping value areas mark balance, migrating value marks imbalance.
- 2Read the current profile's shape: a filling bell says rotation; elongation with thin spots says directional search.
- 3Check the one-timeframing state: successive periods holding one direction mark active imbalance; the first violation hints the drive is loosening.
- 4Watch the balance-area edges: probes that fail and return continue the balance; closes and time building outside begin the imbalance case.
- 5Demand acceptance evidence for breaks: time spent, volume transacted (volume at breakout), and value building outside the old area separate excursions from transitions.
- 6Re-classify continuously: balances break and imbalances exhaust into new balances, and the playbook flips with the state.
How traders use it
- In balance: trade rotation, fading the edges of the range back toward the point of control and taking profits inside value instead of counting on breakouts.
- In imbalance: trade continuation, joining pullbacks in the direction of range extension and avoiding fades until the market builds a new area of balance.
- At transitions: watch look-above-and-fail or look-below-and-fail moves at balance edges for reversion entries, and use acceptance (time and volume spent outside) to confirm a genuine directional auction has started.
- With VWAP as the rotation axis: in balance, price oscillates around a flat session VWAP and reversion trades key off it; a VWAP that slopes away with price is the average's vote that imbalance has taken over.
- With participation checks: range extension on strong relative volume supports the imbalance read, while breaks attempted on thin participation are the classic look-and-fail candidates.
Balance vs imbalance and its measurement tools
Value Area: The value area is a component measurement, the central band of one profile. Balance versus imbalance is the regime judgment built from how successive value areas relate: overlap says balance, migration says imbalance.
TPO Profile: The TPO profile is the instrument; balance/imbalance is the diagnosis. Shape, value overlap, and one-timeframing are all read off the profile, which is why the classification tradition and the charting format are inseparable.
Volume at Breakout: Breakout volume is one acceptance criterion within the framework: it grades whether an excursion beyond balance is funded. The balance/imbalance distinction is the larger question that the volume evidence helps answer.
Concept family
Volume & Order Flow
88 concepts mapped · 88 in the Library
Balance vs Imbalance FAQ
Turn Balance vs Imbalance into a trading strategy.
Take the implementation from this page into Quant, then build on it, backtest it on real data, and keep refining it in conversation.