Single Prints
 By LuxAlgoApr 4, 2026
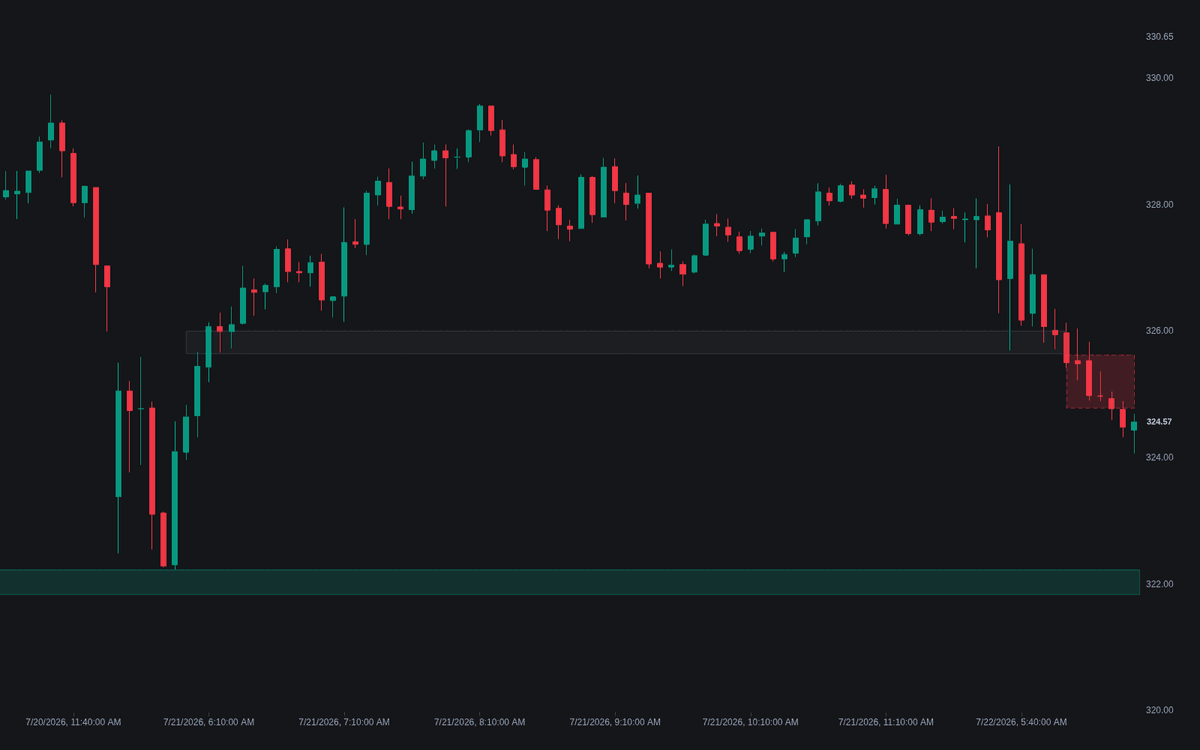

Single Prints finds the thin stretches a fast one-directional move leaves in a time-price distribution, the definitive clean implementation of single prints as standing reference zones. Each anchor period assembles its own TPO profile from bracket ranges; when it completes, every interior run of rows covered by exactly one bracket becomes a colored box, extended right until price auctions through it.
How to Trade the Single Prints?
- First retest: judge the reaction at the zone's edges: rejection keeps the imbalance intact, trading through begins the repair.
- Defended probe: a poke into a zone that closes back outside argues the original one-sided move is still being respected.
- Repair: once the whole range has been traded through, the box freezes as a muted ghost (or is removed), a retired level.
- Developing singles: dashed boxes mark initiative range extension inside the live session while it lasts.
Rising-bracket boxes are watched as potential support, falling-bracket boxes as resistance, beside the other auction and order-flow tools reading the same sessions.
Single Prints Settings
- Profile Anchor (default D): span of each profile. One session per profile is the classic frame.
- TPO Period (default 30): bracket duration; must be at or above the chart timeframe.
- Row Sizing (default Auto) with Auto Row Count (default 40) or Ticks Per Row (default 10): how the profile range is quantized into rows.
- Minimum Height (Rows) (default 1): discards runs spanning fewer rows than this.
- Developing Single Prints (default on): live-session singles, drawn dashed.
- Keep Repaired Zones (default on) and Maximum Zones (default 50): what stays on the chart and for how long.
- Fill Transparency (default 80): zone shading; borders draw more opaque.
Frequently Asked Questions

Original indicatorBuilt in-house by LuxAlgo
The Library is free. Quant makes it yours.
Pull any concept or indicator into Quant: rebuild it, retune it, or turn it into a backtested strategy of your own.