Concept
Profile Shape Taxonomy
Profile Shape Taxonomy is a Volume & Order Flow concept. The Library holds 1 implementation, a working definition you can pull into Quant.
D-day, P-day, b-day, double-distribution
Top Profile Shape Taxonomy indicator
The top custom implementation, built on the original standard Profile Shape Taxonomy formula.
1 total
This Profile Shape Taxonomy implementation is strategy-ready: open it in Quant, set your rules, and it backtests automatically.
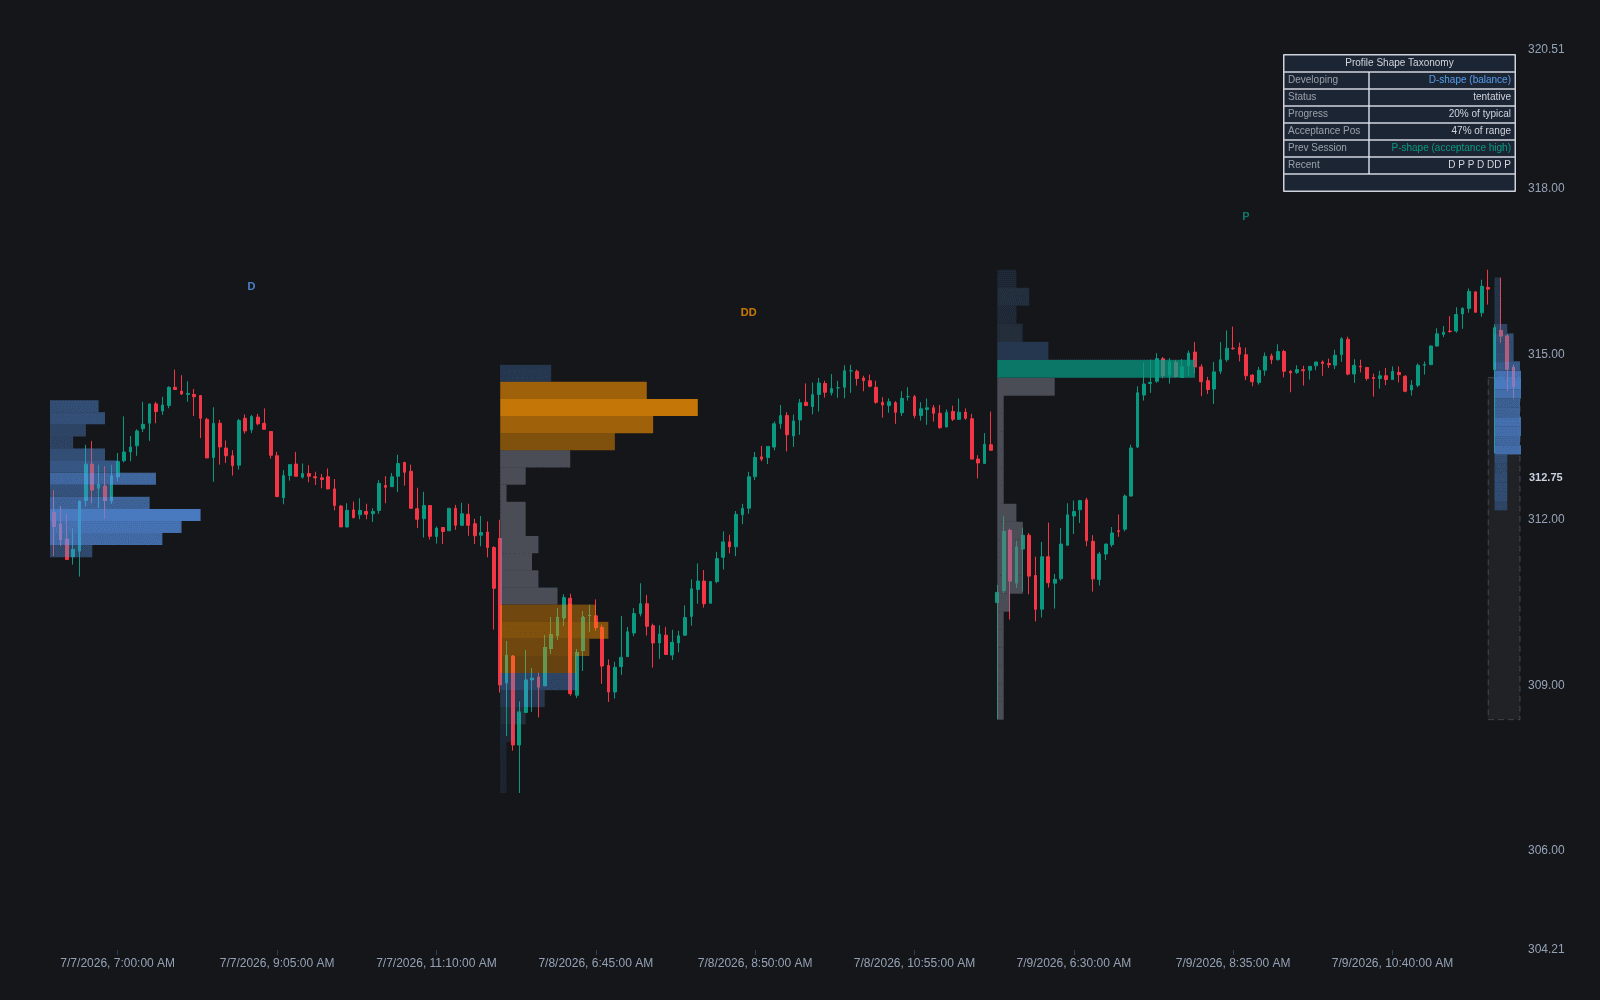
What is profile shape taxonomy?
Profile shape taxonomy is the practice of classifying a session's volume profile or TPO profile by its overall silhouette, and reading each shape as a distinct auction story. The classic labels come from Market Profile practice: the D-shaped day (a symmetric bell, balance), the P-shaped day (fat top, thin bottom, short covering or initiative buying that then found acceptance high), the b-shaped day (fat bottom, thin top, long liquidation that stabilized low), and the double-distribution day (two separate fat regions joined by a thin neck, an auction that migrated from one accepted area to another).
The taxonomy exists because the auction framework says shape encodes behavior. Where the profile is fat, price spent time and attracted two-sided trade, meaning the market accepted those prices as fair value. Where it is thin, price moved quickly and was rejected. A day's silhouette therefore summarizes who was active, whether the session balanced or trended, and where acceptance ended up, information that a bar chart shows only diffusely. The letters are just mnemonic: profiles are conventionally drawn with volume horizontal, so a bell looks like a D, top-heavy looks like a P, and bottom-heavy looks like a lowercase b.
Traders care because the shape at the close feeds the next session's plan. A D-day suggests continued balance and range trading around its value area; P and b days often mark one-sided inventory adjustments whose thin tails are vulnerable to revisit; a double-distribution day leaves a thin neck of single prints that frequently acts as a reference on retest. The usual caveats apply: shapes are only clean in hindsight, intraday classification changes as the profile builds, and no shape binds tomorrow's auction to any script.
How to classify a session's profile shape
Classification is a matter of where the fat and thin regions sit once the session is reasonably mature.
- 1Build the session profile and locate its widest region, the acceptance zone around the point of control.
- 2One symmetric bulge in the middle with tapering tails is a D-shape: a balanced, rotational session.
- 3A bulge in the upper portion with a thin lower tail is a P-shape: a fast drive up off the lows that then found acceptance high, commonly associated with short covering in downtrends.
- 4A bulge in the lower portion with a thin upper tail is a b-shape: liquidation early, acceptance low, the mirror case.
- 5Two distinct bulges separated by a thin band of single prints is a double distribution: the auction traded one balance, re-priced quickly, and built a second balance at new levels.
- 6Classify tentatively before midday and firmly only late in the session, since an early P regularly grows into a D as rotations fill in.
How traders use it
- Framing the next open: yesterday's shape sets expectations, with balance days favoring responsive trading at the edges and trend or double-distribution days favoring continuation checks, a read that pairs naturally with the 80 percent rule around value areas.
- Trading the thin zones: the necks of double distributions and the tails of P and b days mark rejected prices, and revisits into them tend to move fast, so traders treat them as low-friction zones rather than support.
- Diagnosing inventory: P-days in a downtrend are often read as short covering rather than fresh buying, a warning against assuming a durable low; b-days in an uptrend carry the mirrored caution.
- Tracking transition: a sequence of shapes, such as balance days stacking against a prior trend, helps judge whether the market is building balance versus imbalance and preparing to re-price.
- Keeping it honest: shape reads are context, not signals. Similar silhouettes arise from different flows, and classification error near the close of a choppy session is common.
Profile shapes vs neighboring frameworks
Day type taxonomy: Day types (trend day, normal day, neutral day, and so on) classify sessions by how the range developed relative to the initial balance. Profile shapes classify the finished distribution of volume or time. The two overlap heavily but are read from different evidence.
Open types: Open types classify the first minutes of the auction and hint at what shape may develop. The profile shape is the end-of-day verdict on how that opening conviction actually resolved.
Poor highs and lows: Poor extremes are a feature of a profile's edge, a flat unfinished-looking end, while the shape taxonomy describes the whole silhouette. A single profile can be, for example, a b-day with a poor low.
Concept family
Volume & Order Flow
88 concepts mapped · 88 in the Library
Profile Shape Taxonomy FAQ
Turn Profile Shape Taxonomy into a trading strategy.
Take the implementation from this page into Quant, then build on it, backtest it on real data, and keep refining it in conversation.