Stopping Volume
 By LuxAlgoJun 13, 2026
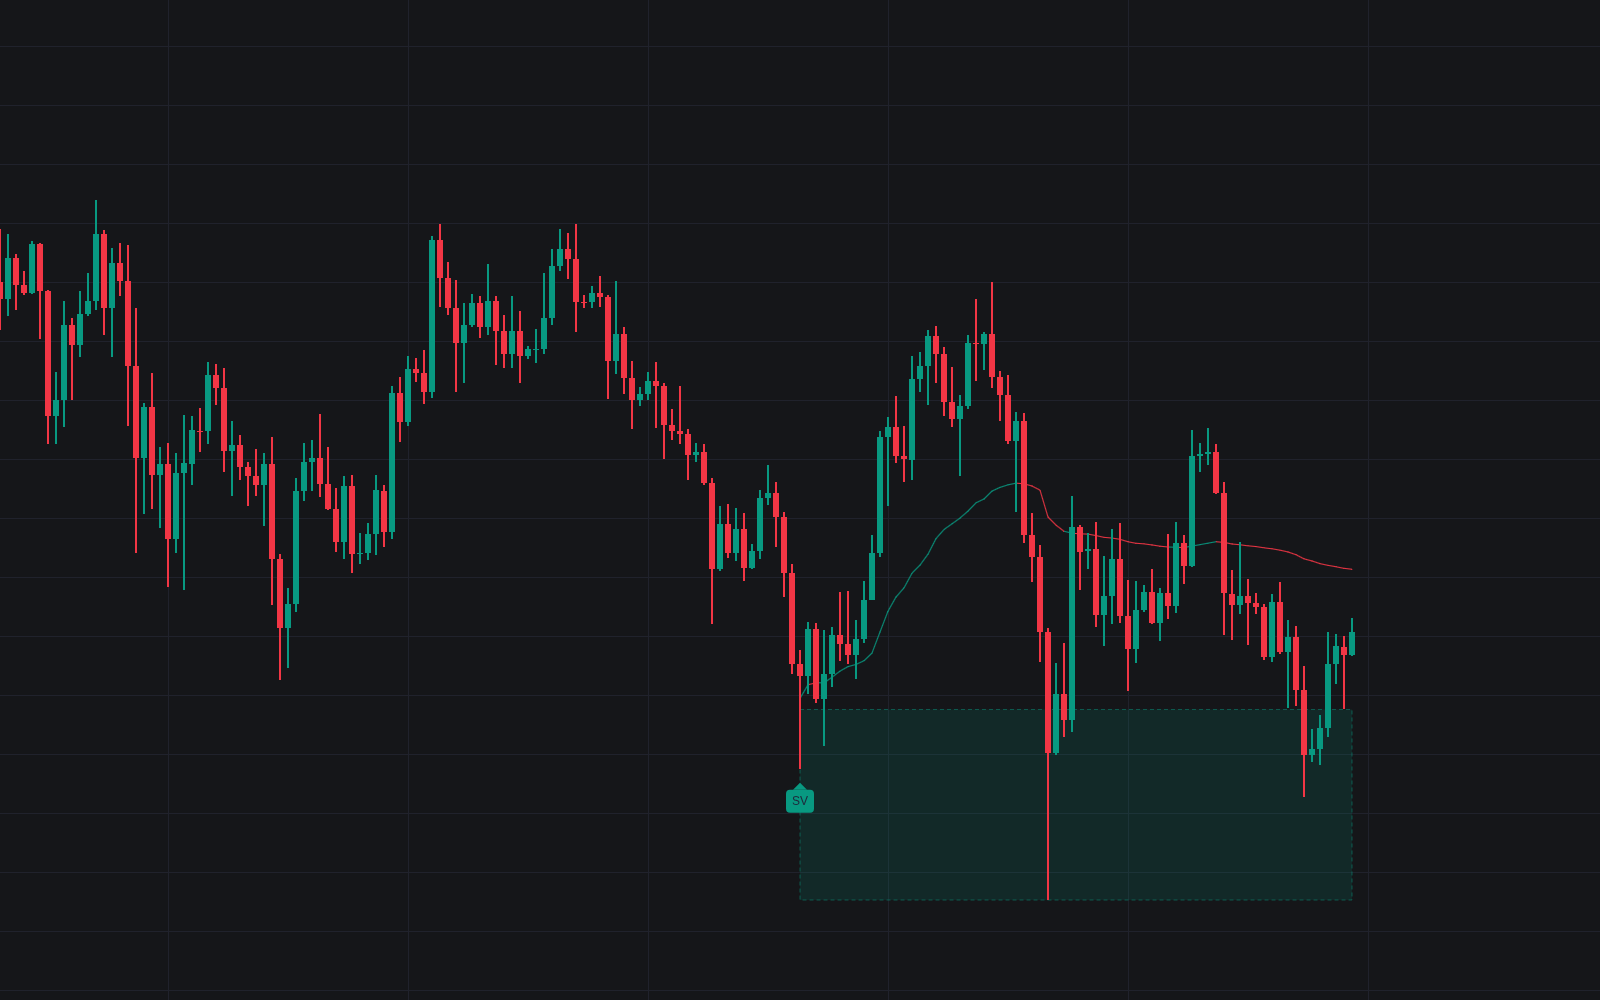

Stopping Volume is a purpose-built detector for stopping volume events, the moment heavy trade halts a sustained decline. A candidate must print the window's lowest low on abnormal volume yet close mid-range or higher; qualifying bars are tagged SV, open a low-to-mid-range absorption zone and anchor a VWAP there.
How to Trade the Stopping Volume?
- SV label: abnormal volume into new lows with the close well off the low. Watch for the decline to stall.
- Stall confirmed: no close below the event extreme within the stall window (huge effort, no result) turns the zone active.
- Test label: a later dip into the zone on visibly shrunken volume, holding: the classic confirmation.
- Supply label and broken zones: heavy volume on a retest warns the decline may resume; a close beyond the event extreme invalidates the zone.
The event-anchored VWAP colors bullish while price holds above it; losing it warns the absorbing buyers are underwater. Eight alerts cover events, stalls, tests, warnings, invalidations and VWAP loss.
Stopping Volume Settings
- Downtrend Lookback (default 20): the candidate must print this window's lowest low.
- Volume Baseline Length (default 20): the relative-volume yardstick.
- Abnormal Volume Multiple (default 2): minimum relative volume for a candidate.
- Minimum Close Position (default 0.5): lowest acceptable close location in the bar range.
- Require Wide Spread (default disabled): also demand above-average range.
- Stall Window (default 5): bars in which a close beyond the extreme voids the setup.
- Detect Topping-Out Volume (default disabled): mirror the whole engine at highs, with TV labels.
- Test Volume Maximum (default 1): highest relative volume allowed on a test.
- Show Event Zones (default enabled), Zone Duration (default 200) and Maximum Tracked Zones (default 5).
- VWAP From Latest Event (default enabled): anchors a VWAP at the newest event bar.
Frequently Asked Questions

Original indicatorBuilt in-house by LuxAlgo
The Library is free. Quant makes it yours.
Pull any concept or indicator into Quant: rebuild it, retune it, or turn it into a backtested strategy of your own.