Volume Spread Analysis
Volume Spread Analysis, also known as VSA, are Volume & Order Flow concepts. The Library holds 5 implementations, each one a working definition you can pull into Quant.
Top Volume Spread Analysis indicators
The top custom implementations, built on the original standard Volume Spread Analysis formula.
5 total
From studying Volume Spread Analysis to trading it: take any implementation below into Quant and backtest it instantly.
What is Volume Spread Analysis?
Volume Spread Analysis (VSA) is a method of reading each price bar through its volume, its spread and where it closes, to infer whether professional money is buying or selling. Volume is judged against recent bars, the spread is the bar's high-to-low range, and the close is located in the top, middle or bottom of that range. VSA was developed by Tom Williams, a British former syndicate trader, from Richard Wyckoff's principles. He set it out in The Undeclared Secrets That Drive the Stock Market (1993), later reworked as Master the Markets, and founded Genie Software, later TradeGuider Systems, to automate the bar classification.
The premise is that large operators cannot hide their volume. When heavy buying absorbs selling, or heavy selling meets buying, the evidence appears as a mismatch between effort and result, Wyckoff's effort vs result law applied to single bars. A wide up bar closing on its high on rising volume is demand at work; an up bar on very high volume that closes mid-range on a narrow spread suggests supply hidden inside the move. VSA's distinctive habit is treating quiet bars as seriously as loud ones: a move made on low volume says professionals declined to take part.
Each bar is read as a sign of strength or a sign of weakness, and the method names its recurring cases. On the strength side sit stopping volume halting a decline, the low-volume test bar that checks for remaining supply, and no-supply dips. On the weakness side sit upthrusts, no-demand rallies and the buying form of climactic action. None of them is read alone: the analyst keeps a running strength/weakness background, and the same bar can be bullish against one background and bearish against another.
This page maps the school; the linked signal pages carry the detailed definitions. VSA's limits are those of any discretionary volume method. The reading order (background, then bar, then confirmation) leaves room for interpretation, thresholds differ between authors and software, tick volume on spot forex weakens the volume leg, and no rigorous public study shows the method is profitable on its own. Order-flow data can audit what VSA infers, since volume delta measures directly the aggression VSA deduces from spread and total volume.
How to read a chart with volume spread analysis
VSA reading runs from context to bar to confirmation. A typical sequence:
- 1Establish the background first: the trend, the position within any trading range, and where heavy volume has appeared recently.
- 2Grade the bar's three variables against recent bars: volume (high, average or low, ideally against a relative volume baseline), spread (wide or narrow) and close (high, middle or low of the range).
- 3Compare effort with result: volume and spread that agree with the close describe a genuine move, while heavy volume with little result, or a large result on no volume, flags a mismatch to explain.
- 4Classify the bar as a sign of strength, a sign of weakness, or neither, using the named cases where they fit.
- 5Wait for the next bar or bars to confirm: a VSA signal nominates a scenario, and the following closes vote on it.
- 6Update the background with the outcome, so each new bar is read against the accumulated evidence rather than in isolation.
How traders use it
- Vetting breakouts and rallies: a push through resistance on narrowing spreads and falling volume lacks the participation VSA expects from genuine demand, a cross-check alongside volume at breakout.
- Timing inside Wyckoff structure: VSA bars supply the bar-level evidence for schematic events, such as a low-volume test or no-supply pullback after a spring.
- Weighting by location: signals count for more at references the market already respects, such as range edges, prior swing extremes or the value-area edges of auction market theory.
- Across timeframes: the background is set on a higher timeframe and signals are taken on a lower one, so a no-demand bar is acted on only when the larger picture already shows weakness.
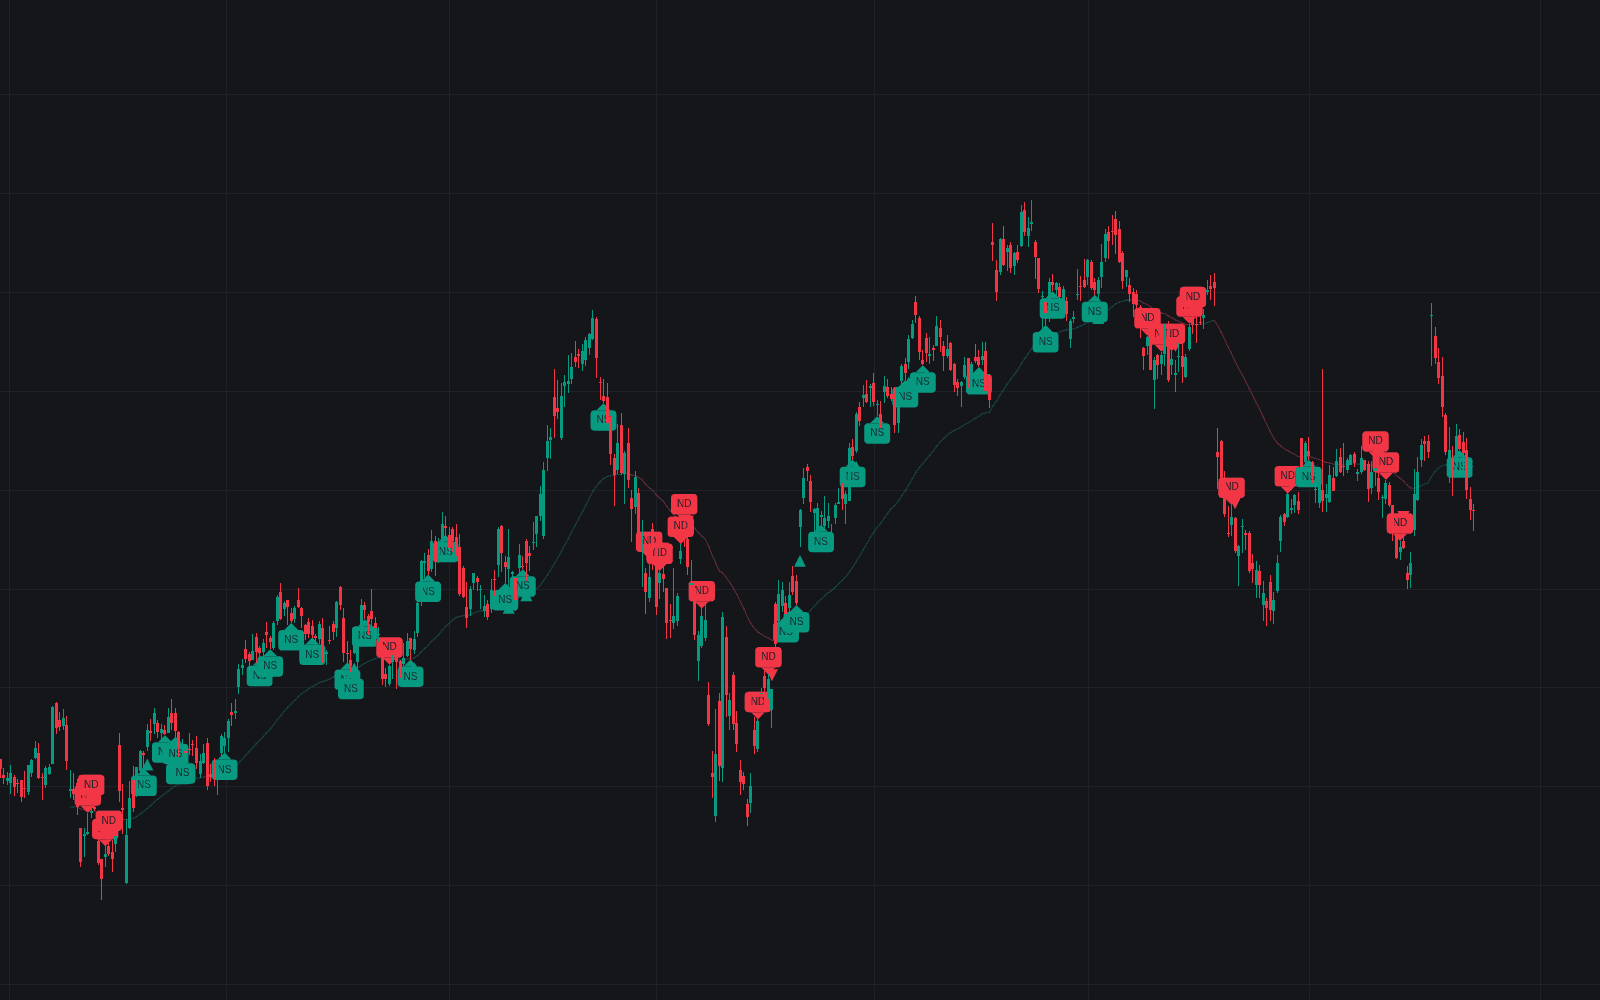
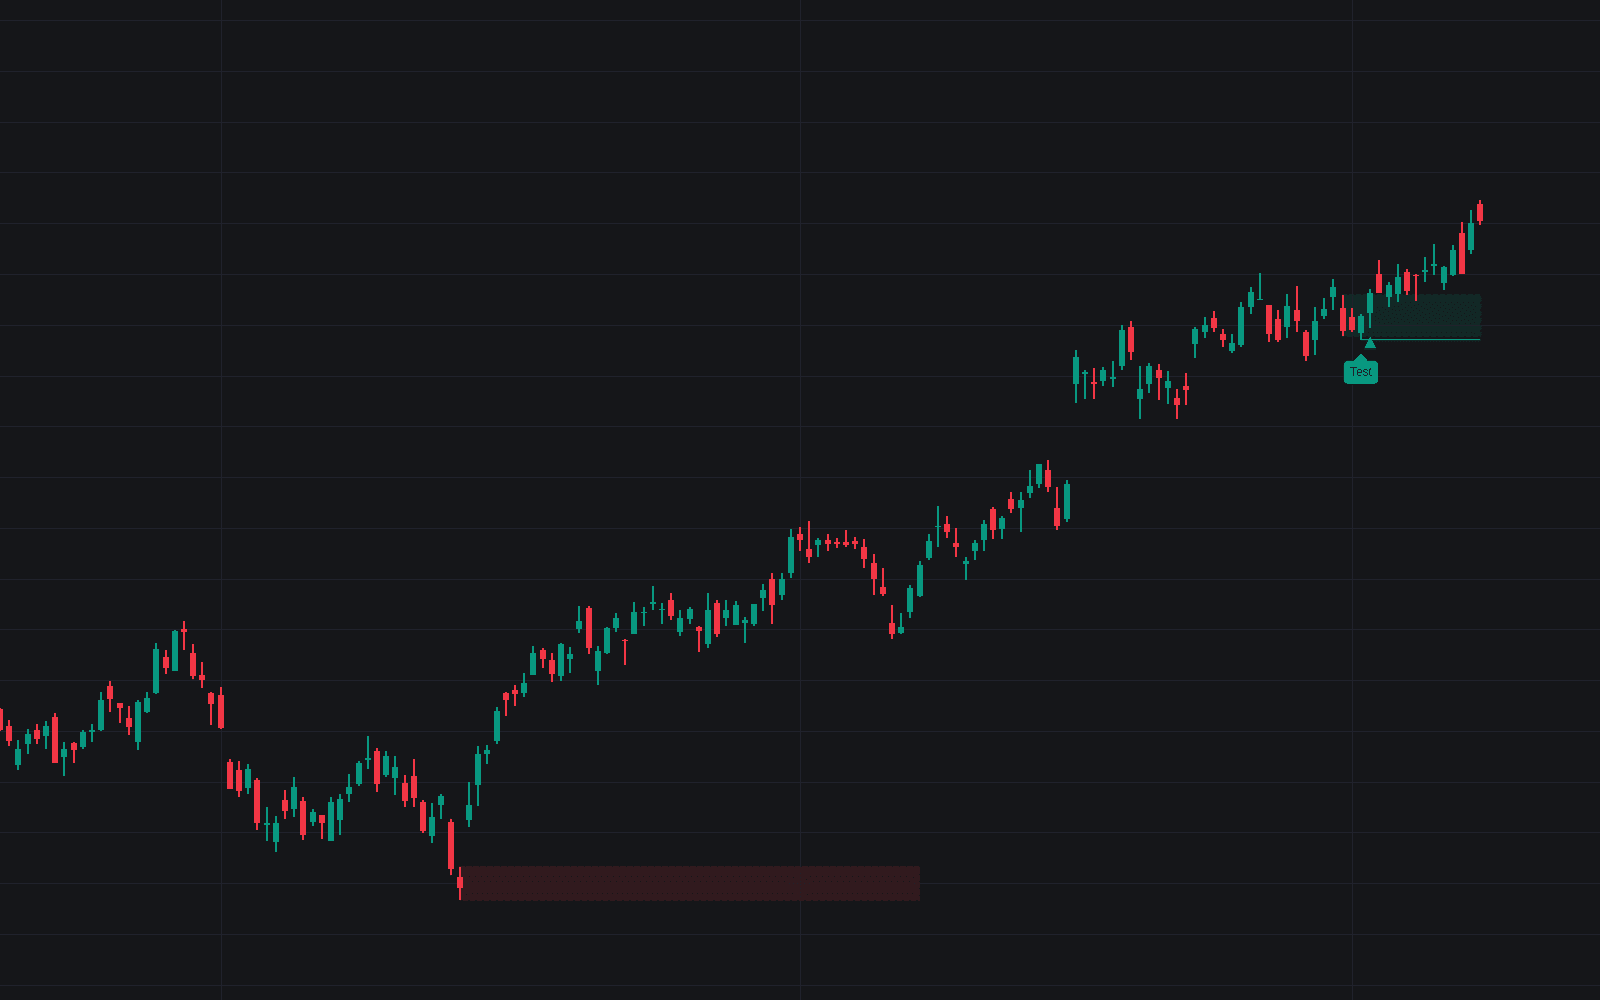
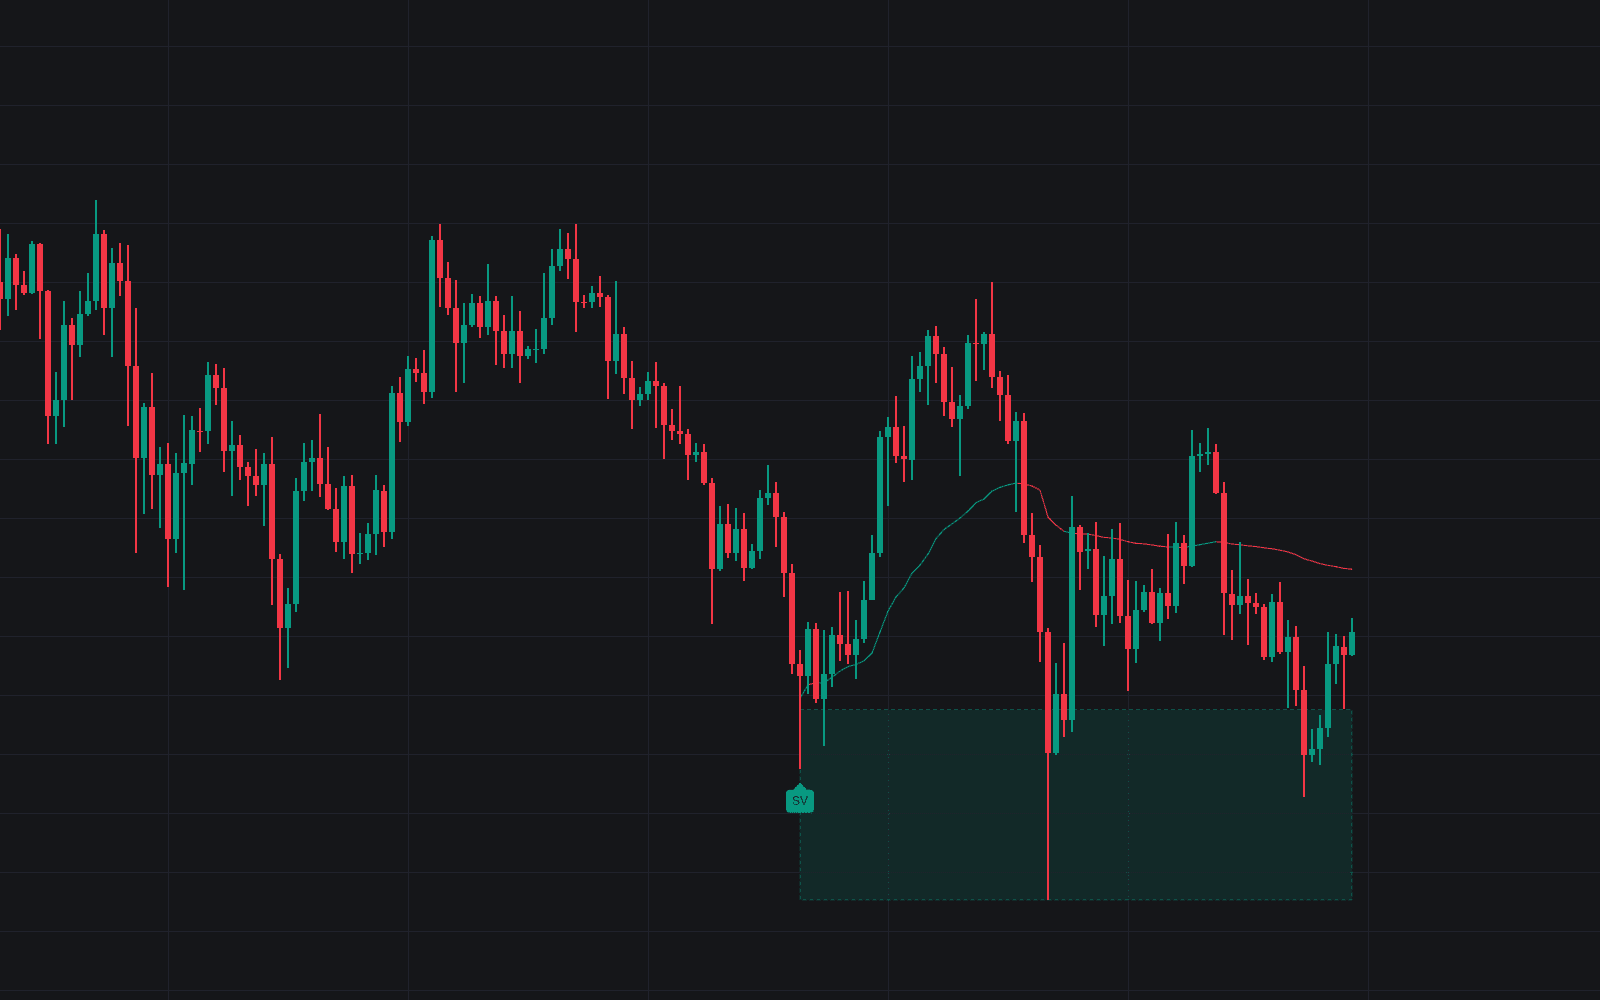
- Automated labeling: LuxAlgo Library builds flag individual cases (No-demand / No-supply Bars, VSA Test Bar, Stopping Volume, Climactic Action) and shade the Strength/weakness Background, with thresholds exposed as settings. Related schemes such as Better Volume classifications turn the same volume-against-range logic into fixed labels.
Volume Spread Analysis vs related frameworks
Wyckoff Method: Wyckoff is VSA's ancestor. The Wyckoff Method works at campaign scale, with trading ranges, phases, schematics and point-and-figure cause counts; VSA concentrates on the individual bar and its neighbors, packaging Wyckoff's reasoning into named bar types that can be scanned.
Effort vs Result: The principle VSA applies to every bar. Effort vs result can be read on swings and whole ranges; VSA turns it into a bar-by-bar vocabulary with a background ledger attached.
Better Volume Classifications: A mechanical labeling scheme benchmarked against rolling extremes. It echoes VSA's inputs (volume, range, close) but assigns fixed labels, where VSA requires the background before a bar earns a meaning.
More Volume Spread Analysis implementations
Concept family
Volume & Order Flow
91 concepts mapped · 91 in the Library
Volume Spread Analysis FAQ
Turn Volume Spread Analysis into a trading strategy.
Take any implementation from this page into Quant, then build on it, backtest it on real data, and keep refining it in conversation.