Concept
Stopping Volume
Stopping Volume is a Volume & Order Flow concept. The Library holds 1 implementation, a working definition you can pull into Quant.
Top Stopping Volume indicator
The top custom implementation, built on the original standard Stopping Volume formula.
1 total
From studying Stopping Volume to trading it: take the implementation below into Quant and backtest it instantly.
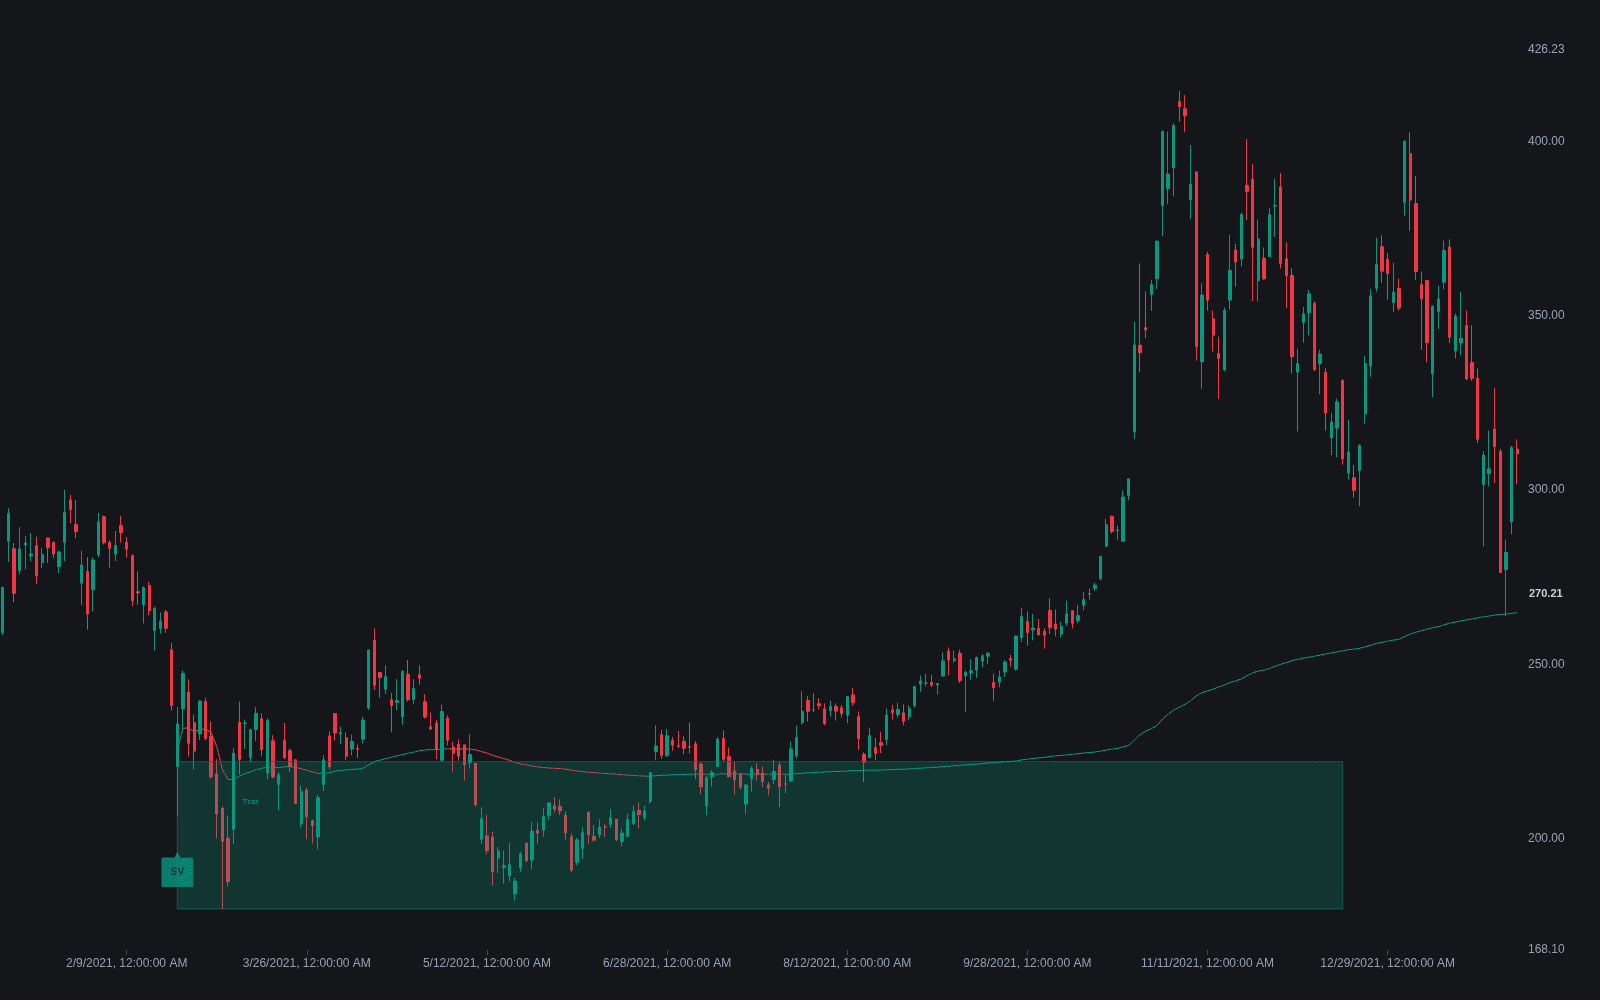
What is Stopping Volume?
Stopping volume is a volume spread analysis term, from the Wyckoff-derived tradition Tom Williams systematized, for the moment heavy volume halts a decline. After a sustained markdown, one or a few bars print clearly abnormal volume while the close finishes well off the low, often mid-range or higher, and downside progress stalls. The reading is that panic selling from the public is being absorbed in size by larger buyers, so supply is being stopped rather than extended.
The vocabulary has a traceable history. Richard Wyckoff taught tape readers in the early twentieth century to weigh price progress against the volume spent achieving it, and the accumulation schematics his tradition produced already contain this event. The British trader Tom Williams reworked that inheritance into volume spread analysis in The Undeclared Secrets That Drive the Stock Market (1993), later republished as Master the Markets, where stopping volume is a named bar condition, carried into the software built on the method.
The tell is the mismatch between huge effort and shrinking result, the general effort-versus-result principle applied at the end of a downmove. Stopping volume overlaps with climactic action, and in Wyckoff schematics it is the behavior expected around preliminary support and the selling climax. It is evidence of demand, not proof of reversal: classic practice waits for confirmation, typically a later test on low volume that fails to find fresh supply.
Judging abnormality is the measurement problem; relative volume is the standard yardstick: the candidate bar should dwarf its own recent baseline rather than clear some absolute threshold. Modern order-flow tools add corroboration the tape readers lacked: a volume profile across the low often shows a fresh high-volume node where the absorption happened, and if that shelf becomes the developing point of control, the auction found real two-sided business at the extreme rather than passing through.
How to identify stopping volume on a chart
The pattern is a contextual read: the trend before, the volume anomaly, the close location, and what follows all matter.
- 1Confirm an established downtrend: a sustained series of lower lows into the candidate area, not a shallow dip inside a range.
- 2Find one or a few bars whose volume stands out sharply against the recent baseline; a relative-volume multiple makes this objective.
- 3Check the close: despite a wide spread, the bar finishes mid-range or higher, showing selling was absorbed within the bar.
- 4Watch the next several bars for stalled downside progress; enormous effort with no further result is the core of the signal.
- 5Wait for the test: a revisit of the zone on clearly lower volume that holds is the classic confirmation; heavy volume returning warns the markdown may resume.
How traders use it
- As a reversal alert: abnormal volume with closes off the lows after an extended decline shifts the bias from shorting continuation to watching for absorption, a higher low, and the start of a base.
- As a location filter: the signal carries more weight arriving into prior demand, a higher-timeframe level, a completed measured move, or the edge of an established value area than in the middle of a range, and it still fails often enough that stops matter.
- As a sequencing cue: after candidate stopping volume, VSA practice looks for a low-volume test of the same area; supply drying up on the retest is the confirmation, while heavy volume reappearing warns the markdown may resume.
- As a delta cross-check: volume delta shows whether aggressive selling was met passively; heavy total volume with delta flattening or flipping positive supports the absorption read.
- As an anchor point: an anchored VWAP from the stopping-volume bar tracks the absorption; price holding above it keeps the accumulation case alive, losing it argues the buyers are underwater.
Stopping Volume vs related volume reads
Volume Spike: A volume spike is the raw anomaly: any bar far above baseline, direction-agnostic and context-free. Stopping volume is one specific interpretation: the spike must arrive after a markdown, close off the lows, and be followed by stalled progress. A spike closing hard on its low reads the opposite way, as continuation. Every stopping-volume event is a spike; few spikes qualify.
Volume Delta: Delta splits each bar's volume into buy-aggressor and sell-aggressor portions. Stopping volume infers absorption from price and total volume alone, as Wyckoff-era readers had to; delta tests the hypothesis directly, showing whether heavy selling was met by passive bids.
Volume Divergence: Volume divergence is gradual: successive new lows on shrinking volume, implying supply exhaustion over many swings. Stopping volume is a single loud event where supply is met all at once. Both are reversal evidence; one whispers, the other shouts.
Concept family
Volume & Order Flow
88 concepts mapped · 88 in the Library
Stopping Volume FAQ
Turn Stopping Volume into a trading strategy.
Take the implementation from this page into Quant, then build on it, backtest it on real data, and keep refining it in conversation.