Concept
Alpha
Alpha is a Statistics concept. The Library holds 1 implementation, a working definition you can pull into Quant.
Jensen
Top Alpha indicator
The top custom implementation, built on the original standard Alpha formula.
1 total
Want to trade Alpha? The implementation below is one prompt away from a backtested strategy in Quant.
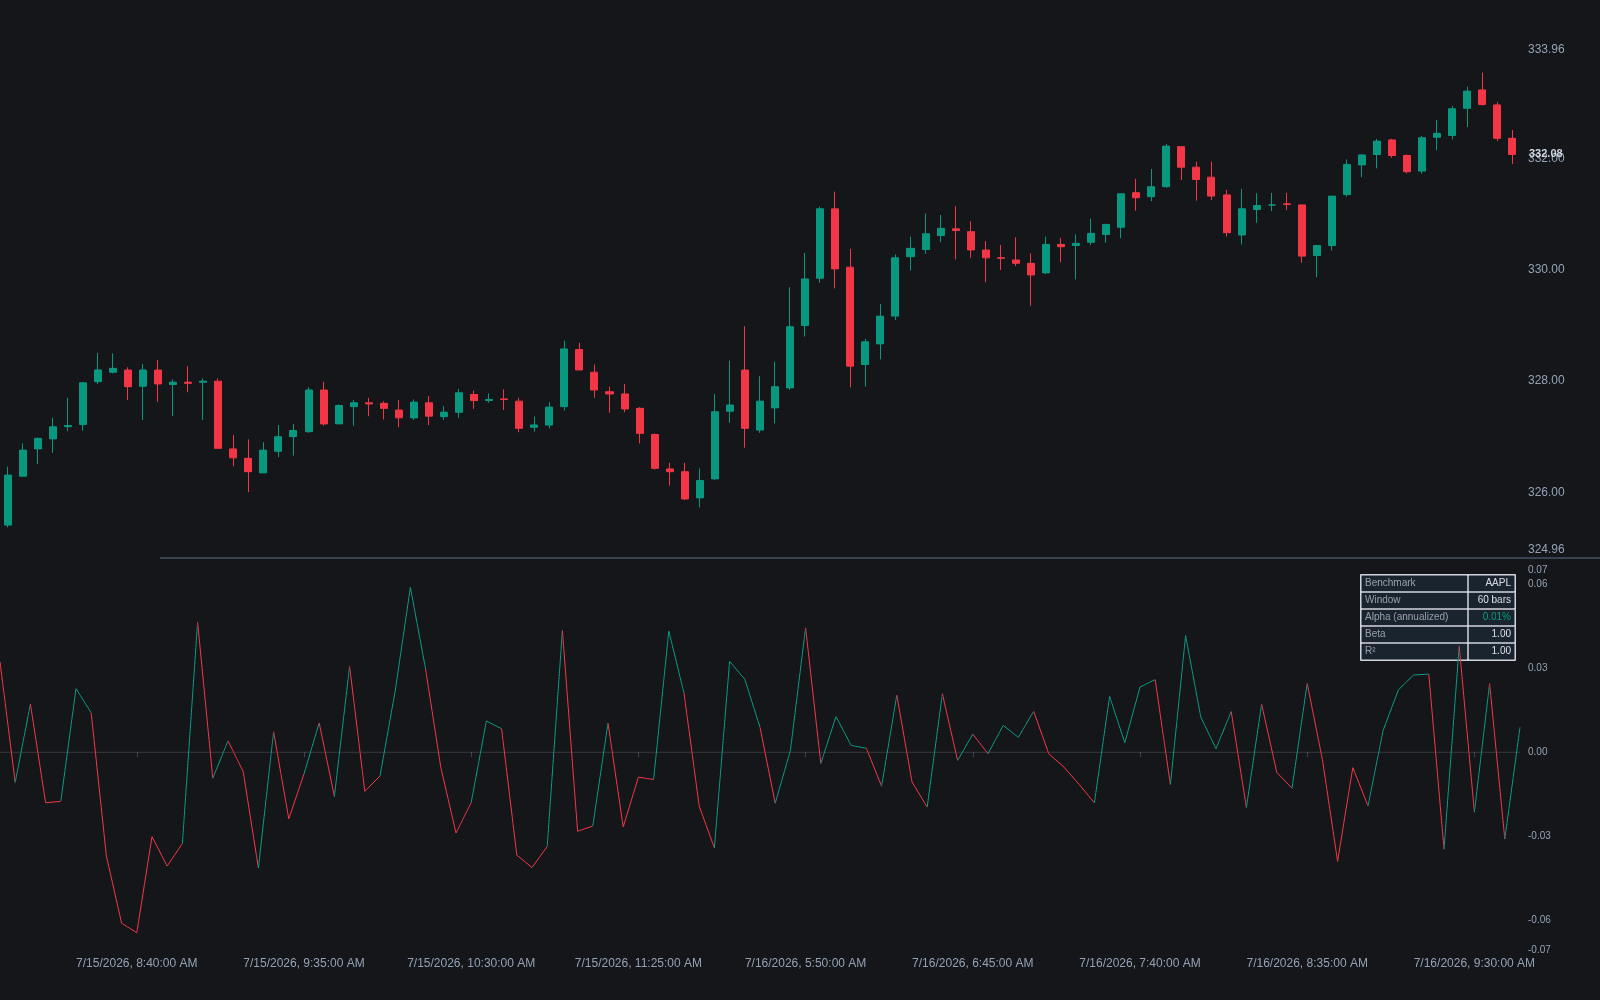
What is Alpha?
Alpha is the part of an asset's or strategy's return that its market exposure does not explain. In Jensen's classic formulation, regress the asset's returns in excess of the risk-free rate on the benchmark's excess returns using linear regression: the slope of that fit is beta, and the intercept is alpha. Positive alpha means the asset earned more over the window than its benchmark sensitivity alone would have predicted; negative alpha means it earned less.
The formulation traces to Michael Jensen, whose 1968 study of mutual fund performance used the intercept of a CAPM regression to test whether managers beat the market after adjusting for risk; most did not. Under the capital asset pricing model, expected return is the risk-free rate plus beta times the market premium, so anything persistently above that line reads as skill or mispricing. Factor models later complicated the story: once size, value, and momentum factors join the regression, much of what looked like index-relative alpha is reclassified as factor exposure. Alpha is always relative to the model you specified.
Alpha is an estimate, not a property. It changes with the benchmark chosen, the lookback window, and the return frequency, and short-window readings are noisy. Chart and screener implementations usually compute it as a rolling regression intercept against a reference index, which makes it a relative-performance lens: it shows who is outrunning their market exposure right now, with no promise the outrunning continues.
For chart use the read is comparative. A rolling alpha series shows whether outperformance is expanding or fading, and its stability matters as much as its level, since an intercept that flips sign each window is mostly noise. Fit quality matters too: when the asset's correlation with the benchmark is weak, slope and intercept are both estimated poorly and the reading deserves little weight.
How to calculate alpha
Alpha is the intercept of a returns-on-returns regression; rolling implementations repeat these steps per window.
- 1Pick a benchmark the asset genuinely tracks and a window, commonly 60 to 250 daily or 36 to 60 monthly returns.
- 2Compute per-period returns for both series, subtracting the per-period risk-free rate for the textbook Jensen version; at daily frequency this barely moves the result.
- 3Regress the asset's excess returns on the benchmark's: the slope is beta, and the intercept, the return left when the benchmark contributes nothing, is alpha.
- 4Annualize for readability if desired, noting platforms differ in whether they scale or compound the per-period intercept.
- 5Judge reliability: check the fit's R-squared and recompute on shifted windows; an alpha that survives window changes deserves more attention than a single print.
How it's calculated
The portion of a strategy's or portfolio's return not explained by its benchmark exposure, per the CAPM (Jensen's alpha).
All returns must cover the same period and frequency, and alpha is usually annualized.
A common shortcut skips beta and the risk-free rate and reports the plain excess return R_p - R_m.
Alpha is a backward-looking estimate and sensitive to the benchmark chosen.
How traders use it
- Screening: ranking symbols by rolling alpha against an index surfaces names outperforming beyond what their beta explains, a shortlist for further work rather than a buy list.
- Strategy evaluation: computing alpha on backtest returns separates timing or selection skill from returns that are simply market exposure in disguise; a system with high raw returns and near-zero alpha is mostly repackaged beta.
- Portfolio reads alongside beta: near-zero beta with positive alpha describes a return stream largely independent of the index, very different from a high-beta book with the same headline return.
- Persistence checks: before acting on a rolling-alpha ranking, see whether the series persists or reshuffles, in effect its autocorrelation; a leaderboard that reorders weekly is mostly noise.
- Source-of-return analysis: pairing alpha with distribution-of-returns profiling shows whether the excess came from steady accrual or a few outlier days, which changes how repeatable it is.
Alpha vs related statistics
Correlation: Correlation measures how tightly two return series move together and says nothing about which earned more. Alpha asks the follow-up: given that relationship, what return remains once the benchmark's contribution is removed? A stock can track its index tightly and still carry positive or negative alpha.
Z-score: A z-score normalizes a value against its own history, measuring unusualness in standard deviations. Alpha normalizes performance against a contemporaneous benchmark through regression. One is a self-referential yardstick, the other market-relative; screeners often show both.
Percentile Rank: Percentile rank orders values within a lookback or across a universe with no model of why returns differ. Alpha is model-based, crediting only what beta cannot explain: ranking raw returns rewards high-beta names in an up market, while ranking by alpha is designed not to.
Concept family
Statistics
46 concepts mapped · 46 in the Library
Alpha FAQ
Turn Alpha into a trading strategy.
Take the implementation from this page into Quant, then build on it, backtest it on real data, and keep refining it in conversation.