Concept
MA Envelope
MA Envelope, also known as percent bands, is a Trend concept. The Library holds 2 implementations, each one a working definition you can pull into Quant.
Top MA Envelope indicator
The top custom implementation, built on the original standard MA Envelope formula.
2 total
Every MA Envelope implementation here is strategy-ready: open one in Quant, set your rules, and it backtests automatically.
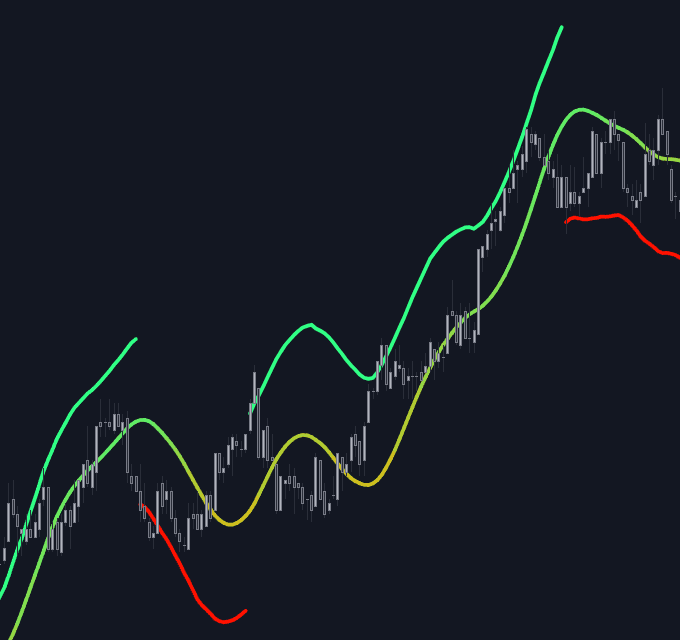
The standard MA Envelope indicator
MA Envelope exactly as classically defined: the faithful reference build of the original formula, free to run in Quant.
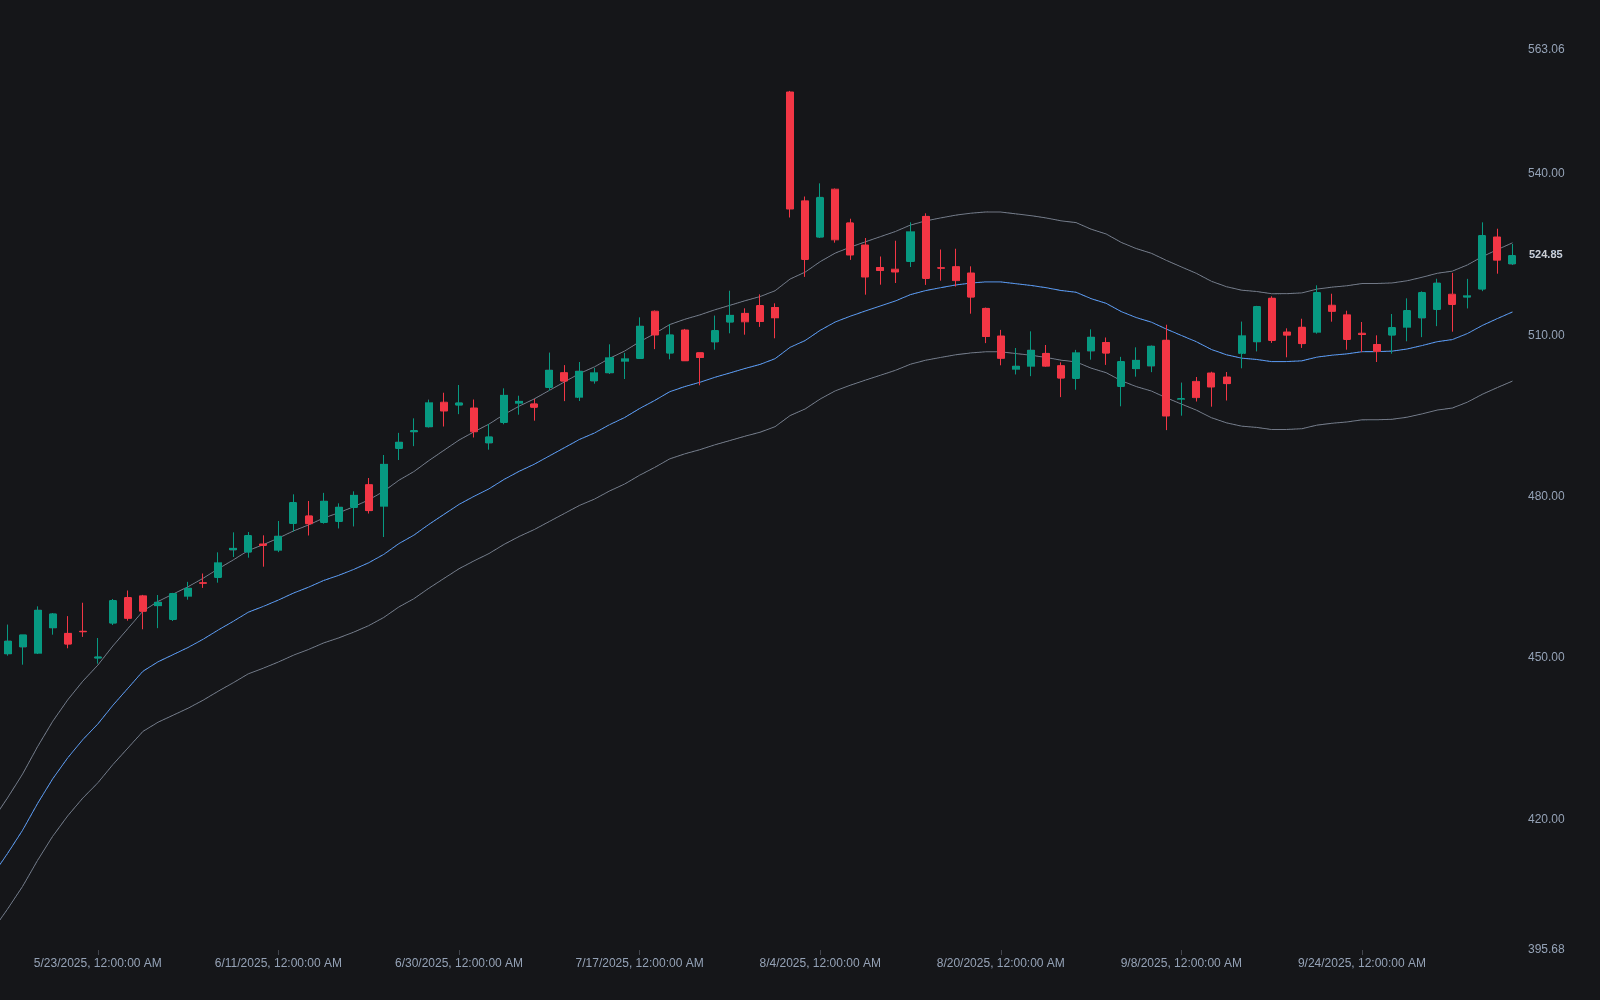
What is an MA Envelope?
An MA Envelope is a moving average with two bands offset above and below it by a fixed amount, most often a set percentage of the average's value (hence the alias "percent bands"). The center line can be any average, with the SMA and EMA the usual choices; the upper and lower bands are simply that line shifted up and down by the chosen percent. The result frames how far price has strayed from its own mean.
The defining trait is that the width is constant in percentage terms. Unlike Bollinger Bands, which breathe with measured volatility, an envelope stays the same relative distance from its center in all conditions, so the "right" percent is instrument- and timeframe-specific and has to be tuned by hand. The bands are read as a stretch gauge: a tag of the outer band marks price extended from its mean, which resolves either by rotating back to the center line or by trending along the band. Neither outcome is certain, which is why envelope signals are usually paired with a regime read.
Envelopes are among the older band tools in charting. Constant-width channels around a smoothed centerline were central to J.M. Hurst's cycle work in his 1970 book The Profit Magic of Stock Transaction Timing, and percent envelopes have shipped as a standard study on charting platforms for decades. Their fixed width is also the gap later tools were built to fill: John Bollinger has described his standard-deviation bands as an evolution of the percentage bands he had been trading, replacing the hand-tuned offset with a self-adjusting one, which leaves envelopes as the simple, transparent baseline of the band family.
Using one well means matching the offset to the instrument's normal excursion and keeping the regime question in view. The center line's slope carries the trend information, the read formalized by an MA slope filter, while the bands convert distance-from-mean into a visible boundary. Because nothing in the construction adapts, the trader is the adaptation: a percent tuned in calm tape gets tagged constantly in a volatile stretch. Some practitioners prefer exactly that stability, arguing that a reference which never changes shape is easier to build consistent rules and trend regime labels around than bands that breathe.
How to set up an MA envelope
The construction takes three decisions: the average, the length, and the offset.
- 1Choose the center line; 20-period simple or exponential averages are common defaults, and any average type works.
- 2Pick a percent offset p and plot the bands at MA × (1 + p) and MA × (1 − p).
- 3Size p to the instrument: the bands should contain the large majority of recent bars, so a tag is an event rather than routine noise.
- 4Classify what you see: a flat center line with price rotating band to band reads as range; a sloped center line with closes pressing one band reads as trend.
- 5Re-tune deliberately when the volatility regime changes; the envelope will not adapt on its own.
How it's calculated
A moving average centerline with upper and lower bands offset by a fixed percentage of the centerline.
Line 1 shows an SMA basis; EMA or other moving average types are common substitutes.
Band width is a constant percent of the basis, so it does not expand with volatility the way Bollinger Bands do.
Some platforms offer an absolute point offset instead of a percentage.
How traders use it
- For mean reversion in ranges: fading outer-band tags back toward the center line, treating the tag as an overbought or oversold stretch rather than an automatic reversal.
- As a trend qualifier: repeated closes riding one band signal persistent one-way pressure, the same walking-the-band behavior seen in volatility bands.
- As a breakout filter: requiring price to close beyond the band, a full percent offset from the average, before accepting a breakout as more than noise, the same logic as classic percentage filters.
- As dynamic S/R: the center line doubles as a moving-average support/resistance reference while the bands frame the expected excursion around it.
- As a directional gate: taking longs only while price holds above the center line, or the lower band for a looser filter, the way a higher-timeframe trend filter gates entries.
- As a scaffold for grid tactics: spacing scale-ins and take-profits between the center line and the bands, the pattern several envelope-based library scripts automate.
MA Envelope vs other band tools
Supertrend: Both wrap price in offset bands, but Supertrend scales its offset by ATR and turns the band into a one-sided trailing stop that flips with trend. The envelope keeps both bands at fixed relative width and leaves interpretation to the trader.
Dynamic S/R Via MA: Uses the bare moving average as the rail pullbacks are expected to respect. The envelope adds tolerance around that rail, acknowledging that tests overshoot and undershoot rather than touch the line exactly.
MA Ribbon: Many averages of different lengths fanned in parallel rather than one average offset by percent. The ribbon reads trend maturity from its ordering and spread; the envelope reads stretch from tags of a fixed boundary.
Concept family
Trend
100 concepts mapped · 100 in the Library
MA Envelope FAQ
Turn MA Envelope into a trading strategy.
Take any implementation from this page into Quant, then build on it, backtest it on real data, and keep refining it in conversation.