Concept
Participation Divergence at Index Highs
Participation Divergence at Index Highs, also known as breadth washout markers, 90% down days, are Breadth, Sentiment & External Data concepts. The Library holds 1 implementation, a working definition you can pull into Quant.
Top Participation Divergence at Index Highs indicator
The top custom implementation, built on the original standard Participation Divergence at Index Highs formula.
1 total
This Participation Divergence at Index Highs implementation is strategy-ready: open it in Quant, set your rules, and it backtests automatically.
What is Participation Divergence at Index Highs?
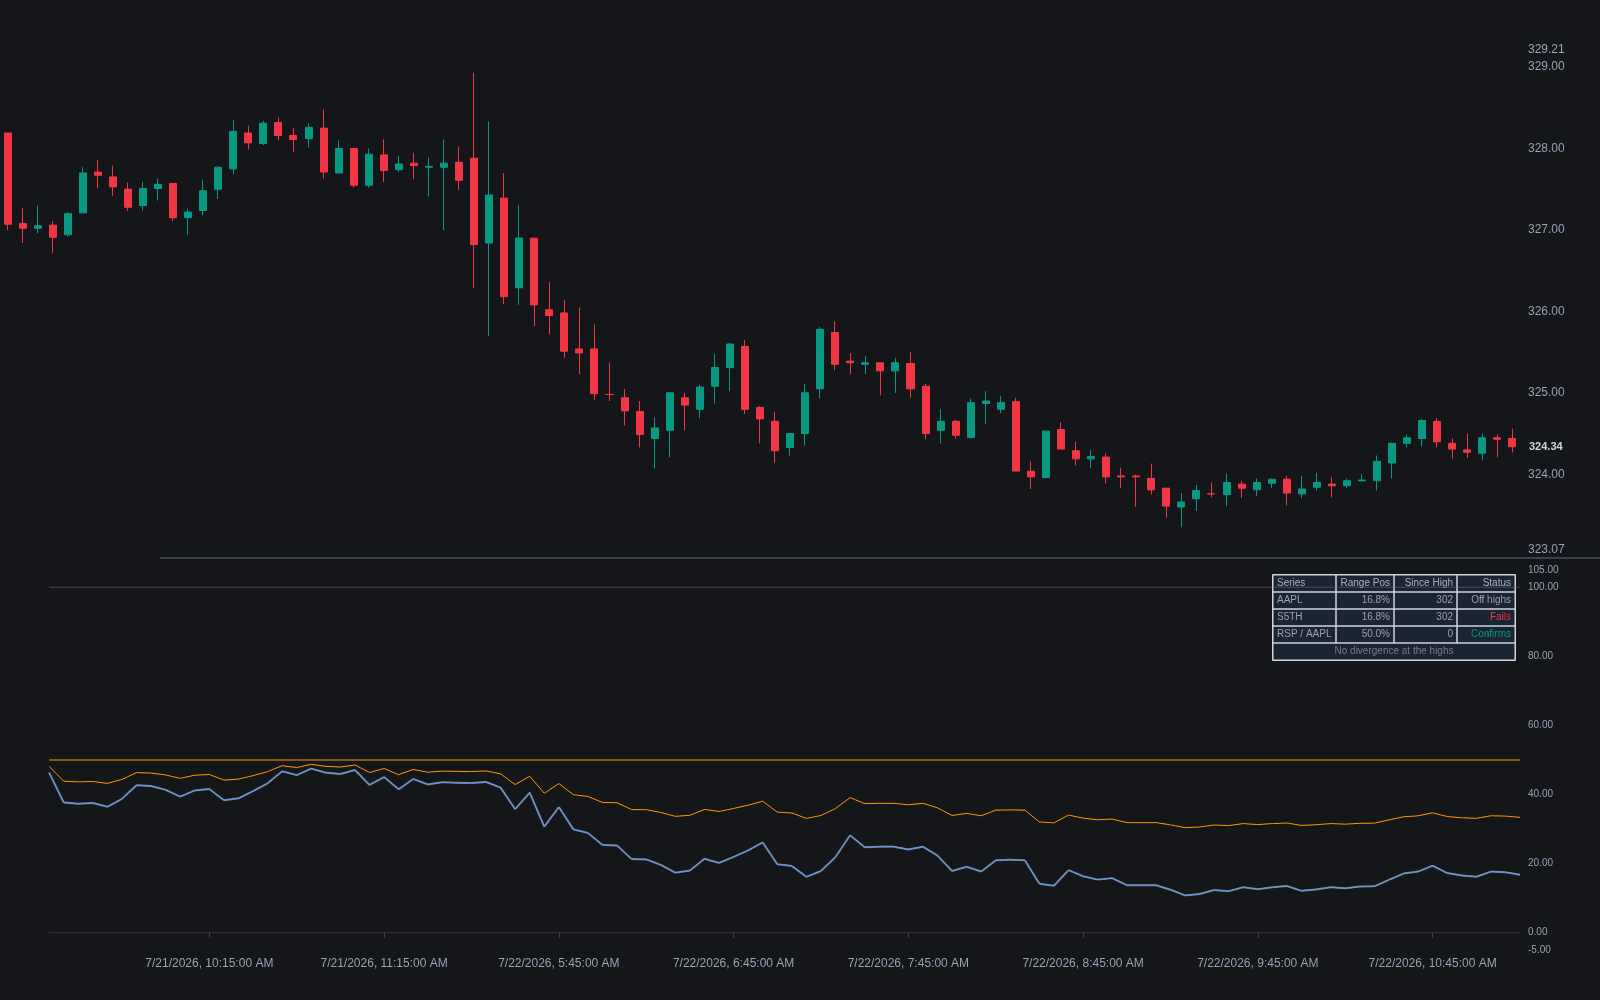
Participation divergence at index highs is the breadth analyst's core warning pattern: a cap-weighted index prints a new high while the measures of participation underneath it do not. The advance/decline line fails to confirm, net new highs shrink, and the share of stocks above their own moving averages rolls over. The index is being carried by fewer, larger names, and the average stock has already stopped going up.
The lineage runs from Dow Theory's non-confirmations through a century of breadth work: analysts have documented deteriorating participation ahead of several of the market's famous tops, and the washout side rests on Paul Desmond's Charles Dow Award-winning research at Lowry, which formalized the 90% day as a measure of panic-grade unanimity. The tradition's claim is consistent across eras: indexes summarize price, breadth summarizes the crowd, and turns tend to show up in the crowd first.
The same lens is applied at the opposite extreme. Breadth washout markers such as 90% down days, sessions where at least 90% of up-plus-down volume and at least 90% of points gained and lost land on the declining side, describe near-total participation in selling. In the research tradition begun by Paul Desmond at Lowry, clusters of such days characterize capitulation, and durable lows tended to require panic selling followed by comparably lopsided buying. Both readings describe participation quality; neither is a standalone timing signal.
The arithmetic behind the pattern is capitalization weighting. A handful of mega-caps can carry a benchmark to new highs while most members decline, so the divergence is measured by lining the index against equal-count evidence: the A/D line, net new highs, the share of members above their 200-day average, and the equal-weight version of the index itself, often watched as a ratio chart against the cap-weighted benchmark. Divergences can also repair, participation broadening back out while the index consolidates, which is why the pattern is monitored rather than sold on sight.
How to identify participation divergence at index highs
The pattern is a comparison between one price series and several participation series; every step is a confirmation check.
- 1Start at the event: the cap-weighted index printing a new high (or pressing the prior one).
- 2Check the A/D line: a lower high in cumulative advances minus declines while price makes a higher high is the classic non-confirmation.
- 3Check net new highs: the count of members at fresh 52-week highs should expand with a healthy index high; shrinking counts flag narrowing leadership.
- 4Check the diffusion gauges: the percentage of members above their 50- and 200-day averages rolling over while the index rises is the same message in bounded form.
- 5Compare equal-weight against cap-weight: the equal-weight index or its ratio to the benchmark failing to confirm shows the average member lagging directly.
- 6Demand persistence and a price trigger: one soft session proves nothing, and even a mature divergence is usually traded only after structure breaks.
How it's calculated
Flags index highs made with shrinking participation, together with washout days where nearly all up/down volume is on the downside.
Participation can also be measured with the advance-decline line or the count of new 52 week highs; the divergence test is unchanged.
The 90% day rule follows Lowry Research (Paul Desmond); strict versions also require 90% of price points lost, and 90% up days are defined symmetrically.
Unchanged issues are excluded from the up/down volume totals.
How traders use it
- As a topping filter: when an index makes a new high, check whether A/D internals, net new highs, and the share of stocks above their 50- and 200-day averages confirm it. Persistent non-confirmation has preceded some major tops, though divergences can also repair without any decline following.
- As washout markers: clustered 90% down days flag indiscriminate liquidation, and frameworks built on Desmond's work then look for a follow-on 90% up day or a breadth thrust as evidence that real demand returned.
- As regime context: narrowing participation argues for tighter risk and more selective longs rather than an immediate reversal trade, since cap-weighted trends can run long after the average stock stalls.
- Through relative lenses: an equal-weight-to-cap-weight ratio chart turns the breadth question into one plottable series, with its downtrends during index highs marking the narrowing directly.
- At session scale: intraday internals such as the TICK index and up/down volume splits grade individual sessions, which is where the 90% day arithmetic actually lives.
Participation divergence vs its measurement tools
Advance/decline Internals: A/D series are the raw material: cumulative and per-session counts of who rose and fell. Participation divergence is the pattern read across them, price at highs while the counts fail, so one is data and the other is the diagnosis.
% Stocks Above 20/50/200-day MA: The diffusion gauge is one witness among several: bounded, equal-count, easy to compare across time. The divergence pattern cross-examines it together with A/D lines, new-high counts, and equal-weight ratios before concluding anything.
Ratio Charts: Ratio charts are the general instrument for relative reads; equal-weight versus cap-weight is the specific ratio that renders breadth as one line. The divergence pattern often cites that ratio, but it is a lens, not the phenomenon.
Concept family
Breadth, Sentiment & External Data
63 concepts mapped · 63 in the Library
Participation Divergence at Index Highs FAQ
Turn Participation Divergence at Index Highs into a trading strategy.
Take the implementation from this page into Quant, then build on it, backtest it on real data, and keep refining it in conversation.