Concept
DXY Correlation Regimes
DXY Correlation Regimes are Breadth, Sentiment & External Data concepts. The Library holds 1 implementation, a working definition you can pull into Quant.
Top DXY Correlation Regimes indicator
The top custom implementation, built on the original standard DXY Correlation Regimes formula.
1 total
From studying DXY Correlation Regimes to trading it: take the implementation below into Quant and backtest it instantly.
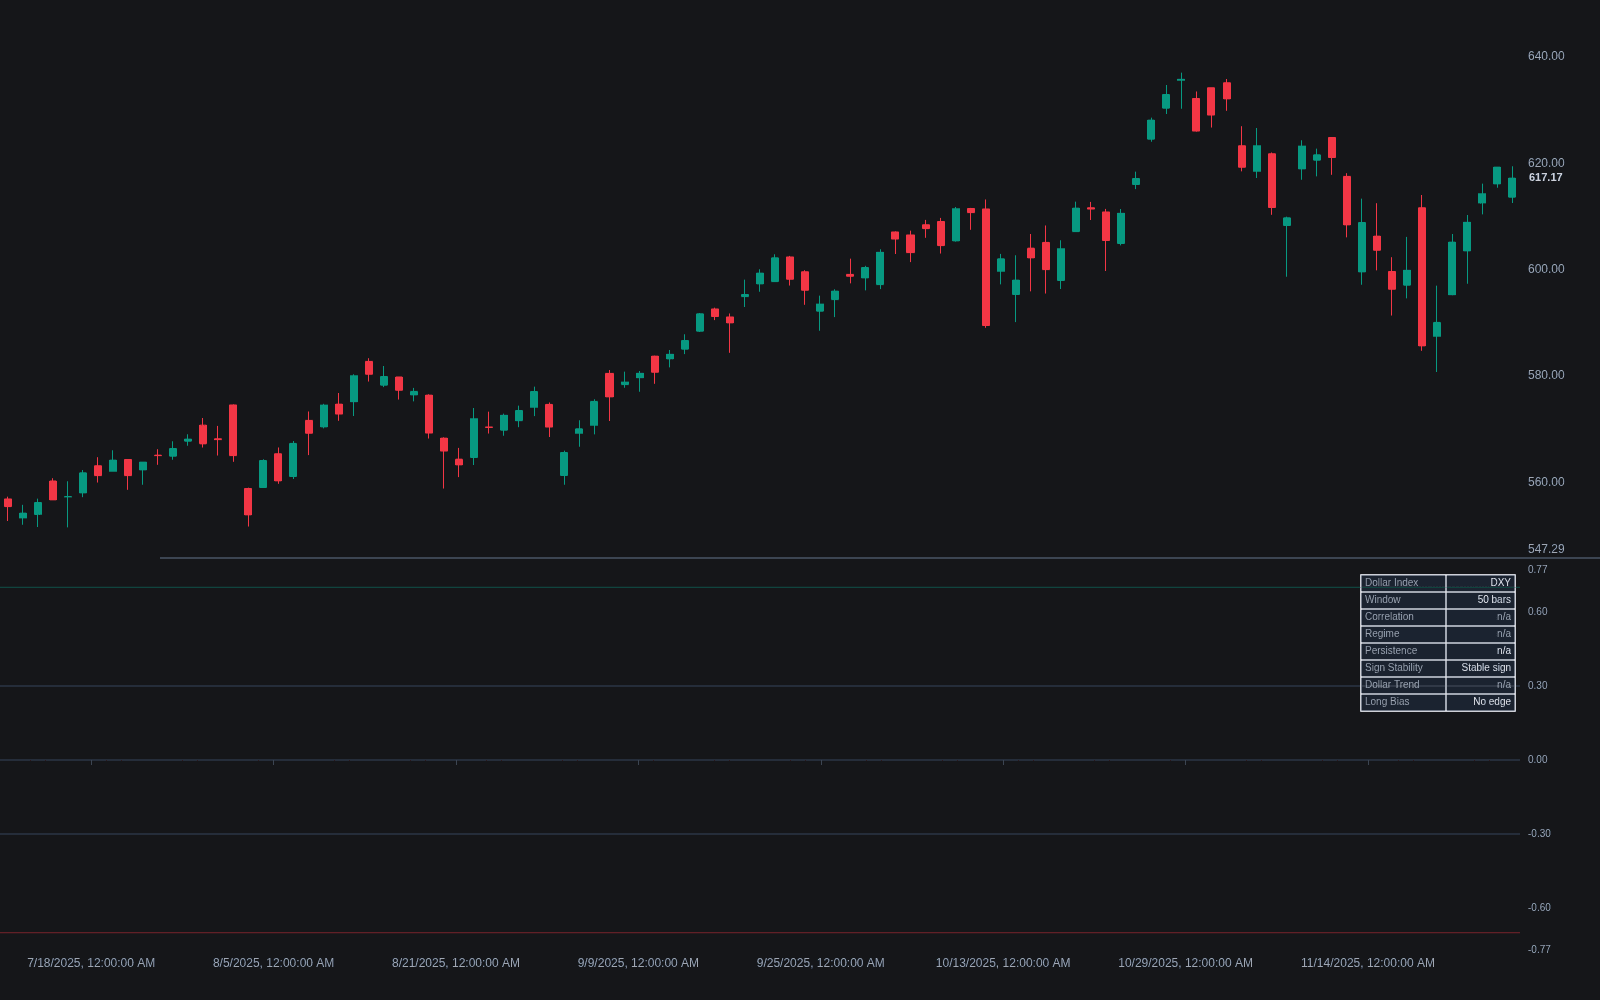
What are DXY Correlation Regimes?
DXY correlation regimes describe how the relationship between the U.S. Dollar Index and other markets shifts over time. DXY is a fixed-weight basket of the dollar against six currencies, dominated by the euro at roughly 57.6 percent of the weight. Risk assets, gold, and commodities often trade inversely to the dollar, but the strength and even the sign of that correlation drift across months: sometimes stocks and the dollar fall together, sometimes dollar strength is exactly what caps a rally. A regime is a stretch where the relationship is stable enough to lean on, usually measured with a rolling correlation of returns.
Traders use the active regime as a filter or a divergence source rather than a standalone signal. Because the euro dominates the basket, DXY behaves close to an inverted EURUSD, which makes small failures of that mirror informative: when one makes a fresh extreme and the other fails to confirm, dollar-based divergence traders read cracks in the move. Rolling correlations lag by construction and regimes end without notice, so the read needs periodic re-verification.
The regime shifts have drivers worth naming. The popular dollar-smile framework describes the dollar bid at both extremes, global crisis (safe-haven flows) and strong US outperformance (rate differentials), and soft in the middle, which is one reason the equity-dollar correlation flips sign across macro eras. The classic couplings each have their own logic: gold's inverse relationship runs through real rates and the dollar's pricing role, commodity and emerging-market inverses through dollar funding, and Bitcoin's inverse coupling only emerged clearly in the macro-driven era after 2020, having been largely absent before, a reminder that every coupling is conditional rather than structural.
In practice the regime work is measurement plus humility. Rolling windows from one to six months form a ladder, with agreement across windows defining a usable regime; sign stability matters more than magnitude; and the euro's dominance means every DXY read deserves a cross-check against EURUSD itself, plus a currency strength meter when the question is which legs are actually driving. Divergence tooling like the SMT DXY study automates the failed-mirror detection, and the broader dashboard belongs to intermarket analysis: knowing which assets are currently coupled tells you which charts must be consulted before a trade.
How to identify the active DXY regime
A regime is a measured, persistent relationship; identification is the measuring and the persistence test.
- 1Choose the asset pair to test, DXY against the instrument you trade, and work in returns rather than price levels.
- 2Compute rolling correlations across a ladder of windows, commonly one, three and six months, so one window's noise cannot masquerade as a regime.
- 3Classify the state: persistently negative across windows is an inverse regime, persistently positive a coupled one, and sign-flipping means no usable regime exists.
- 4Cross-check the mirror: because the euro dominates the basket, verify DXY moves against EURUSD, and treat basket-versus-euro disagreements as breadth information about the dollar move.
- 5Re-verify on schedule and after macro shifts: rolling correlations lag by construction, and the regime that justified a filter can be gone weeks before the window admits it.
How it's calculated
Classifies the rolling correlation between an asset's returns and US Dollar Index returns into positive, neutral, or inverse regimes.
The rolling Pearson correlation is the standard core; log returns ln(P_t / P_(t-1)) are an equally common input and give near-identical results.
Window and threshold are conventions rather than published standards; windows of 20 to 90 bars and thresholds of 0.3 to 0.5 are typical.
Correlating price levels instead of returns overstates the relationship and is best avoided.
How traders use it
- As a directional filter: in a strongly inverse regime, a rising dollar argues against fresh longs in euro pairs, gold, or other dollar-sensitive assets until the correlation itself weakens.
- As a divergence engine: comparing DXY against euro-heavy pairs for failed mirror moves, the same logic formalized in Smart Money Technique divergence.
- As part of a broader intermarket analysis dashboard: knowing which assets are currently coupled to the dollar tells you which charts to consult before taking a trade.
- Decomposed by currency: when DXY moves, a strength meter shows whether the euro leg or the smaller components drove it, separating broad dollar moves from single-pair events wearing the index's clothes.
- Paired with risk gauges: dollar bid alongside rising VIX is the classic risk-off coupling, and the pair confirming each other distinguishes a macro flight from a rate-differential grind that touches risk assets differently.
DXY regimes vs related cross-market tools
Correlation: Correlation is the statistic; the regime framework is its disciplined application, returns not levels, windows in ladders, persistence requirements, and the standing assumption that every relationship is temporary. The statistic misleads exactly when used without the discipline.
Intermarket Analysis: Intermarket analysis is the whole discipline of reading linked markets, bonds, commodities, currencies, equities. DXY regime work is its dollar-specific slice, narrow enough to operationalize as a daily filter and divergence source rather than a research project.
Currency Strength Meter: The meter decomposes strength per currency across many pairs; DXY compresses the dollar into one fixed-weight number dominated by the euro. The meter answers which currencies moved; DXY answers how the headline dollar traded. Regime work benefits from consulting both.
Concept family
Breadth, Sentiment & External Data
63 concepts mapped · 63 in the Library
DXY Correlation Regimes FAQ
Turn DXY Correlation Regimes into a trading strategy.
Take the implementation from this page into Quant, then build on it, backtest it on real data, and keep refining it in conversation.