Concept
New Highs − New Lows
New Highs − New Lows, also known as record-high percent, are Breadth, Sentiment & External Data concepts. The Library holds 1 implementation, a working definition you can pull into Quant.
Top New Highs − New Lows indicator
The top custom implementation, built on the original standard New Highs − New Lows formula.
1 total
This New Highs − New Lows implementation is strategy-ready: open it in Quant, set your rules, and it backtests automatically.
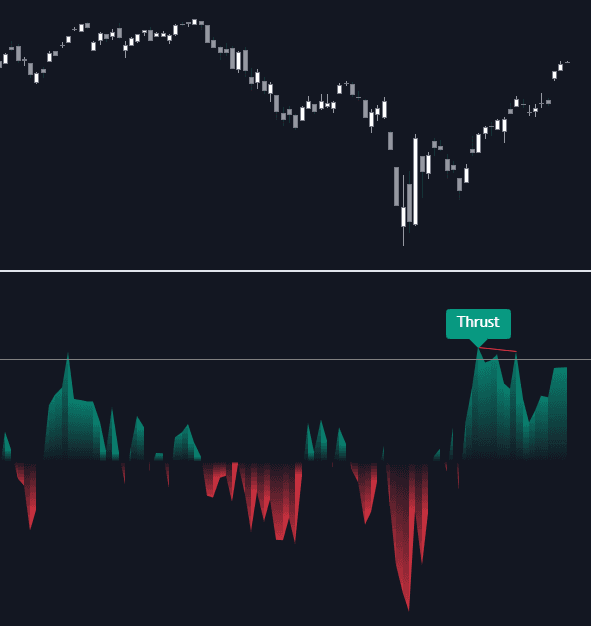
What is New Highs − New Lows?
New Highs − New Lows (net new highs) is a breadth measure: each day, count the stocks in an exchange or index making fresh 52-week highs, subtract those making fresh 52-week lows, and plot the result. It answers a question a cap-weighted index cannot: how many individual names are strong enough to trade at 52-week extremes, and how many are breaking down. Sustained positive readings describe broad participation; sustained negative readings describe deterioration underneath the surface, whatever the index itself is doing.
The raw daily series is noisy, so it is usually smoothed or transformed: a cumulative NH-NL line, a moving average, or the record high percent, which normalizes the count as new highs divided by the sum of new highs and new lows. Values also depend on the universe (NYSE, Nasdaq, S&P 500 constituents), so the same day can print different readings on different feeds.
The measure has a long analytical lineage, including a famously contrarian branch. Norman Fosback's High-Low Logic Index takes the smaller of new highs and new lows as a fraction of issues traded: when both counts are large at once, the tape is split, strength and breakdown coexisting, which his work read as unhealthy. The Hindenburg Omen later stacked extra conditions on that split-market idea and acquired a doom-laden reputation its hit rate never earned. The durable insight is simpler: it matters not just whether highs outnumber lows, but whether the market can produce both in size simultaneously.
Universe quirks are half the craft. The NYSE list includes closed-end bond funds, preferreds and other rate-sensitive issues, so rate shocks can swing its counts in ways that say little about common stocks; the Nasdaq list turns over quickly and skews young and speculative. Reading conventions follow from purpose: the 52-week window is the standard, shorter windows like 20 or 63 days give faster, noisier participation reads, and toolkits such as LuxAlgo's Market Breadth Toolkit compute the counts across selectable universes so the same logic travels between markets.
How to identify NH-NL readings on a chart
The construction is a count, but the meaning depends entirely on universe, window, and smoothing, so identification starts with those choices.
- 1Fix the universe deliberately, NYSE, Nasdaq, or index constituents, and keep it constant; cross-feed comparisons are apples to oranges.
- 2Fix the window: 52-week extremes are the convention; shorter windows trade significance for speed.
- 3Compute the daily counts and the net; expect a jumpy series with occasional violent one-day spikes.
- 4Smooth for signal: a 10-day average, a cumulative line, or the record high percent, each turning the raw count into something comparable over time.
- 5Read it against price: expanding net new highs alongside index advances confirms; shrinking net new highs at fresh index highs warns; and both counts large at once flags a split tape.
How traders use it
- As trend confirmation: an index advance accompanied by expanding net new highs has broad sponsorship, while new index highs on shrinking net new highs is the classic warning of narrowing leadership, usually examined alongside advance/decline internals.
- As a washout marker: spikes in new lows crowd into selloffs, and some traders watch for new lows to stop expanding while price makes a further low as early evidence that selling pressure is drying up. That is a tendency, not a rule.
- In smoothed form: a cumulative NH-NL line or the record high percent turns a jumpy daily count into a slower gauge that can be compared with its own history or run through breadth-thrust style threshold rules.
- As a split-market warning: elevated new highs and new lows together, the High-Low Logic condition, flags a divided tape where rotation is violent underneath a calm index, historically a lower-quality environment for trend trades.
- Paired across timescales: structural NH-NL context combined with a fast session gauge like the TICK Index separates day-scale noise from genuine participation shifts.
NH-NL vs other breadth gauges
Advance/Decline Internals: A/D counts every stock's daily direction, so it moves fast and captures shallow participation. NH-NL only scores names at 52-week extremes, a much higher bar, making it slower and stickier. A/D asks who advanced today; NH-NL asks who is winning the whole year.
% Stocks Above 20/50/200-day MA: Percent-above-MA measures how much of the universe holds above a reference average, a graded participation read that mean-reverts with swings. NH-NL counts only the extremes of the distribution. The MA version tells you the middle of the tape; NH-NL tells you its tails.
VIX: VIX prices index hedging demand from options; NH-NL counts actual stocks at actual extremes. One is a forward-looking price of fear, the other a backward-looking census of strength and damage. They disagree usefully: quiet VIX over deteriorating NH-NL is complacency with rot underneath.
Concept family
Breadth, Sentiment & External Data
63 concepts mapped · 63 in the Library
New Highs − New Lows FAQ
Turn New Highs − New Lows into a trading strategy.
Take the implementation from this page into Quant, then build on it, backtest it on real data, and keep refining it in conversation.