Concept
% Stocks Above 20/50/200-day MA
% Stocks Above 20/50/200-day MA, also known as diffusion indices, is a Breadth, Sentiment & External Data concept. The Library holds 1 implementation, a working definition you can pull into Quant.
Top % Stocks Above 20/50/200-day MA indicator
The top custom implementation, built on the original standard % Stocks Above 20/50/200-day MA formula.
1 total
From studying % Stocks Above 20/50/200-day MA to trading it: take the implementation below into Quant and backtest it instantly.
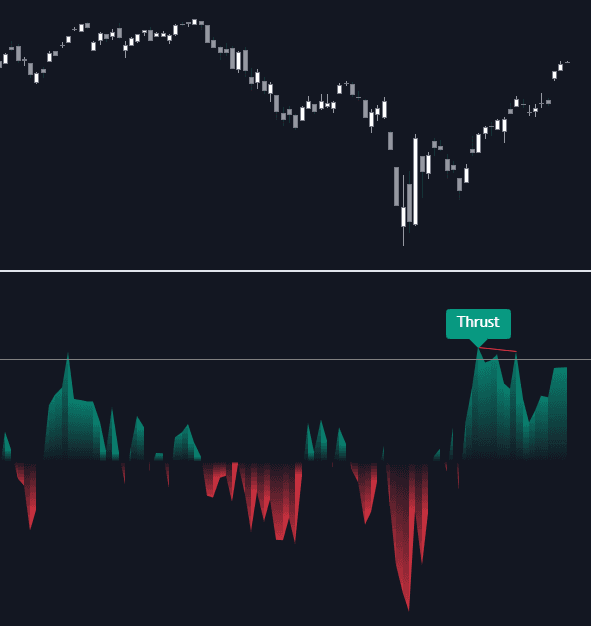
What is % Stocks Above 20/50/200-day MA?
The percentage of stocks above a moving average is a diffusion index: score each constituent of an index or exchange 1 if it trades above its own N-day simple moving average and 0 if not, then express the sum as a percentage of all members. The result is bounded between 0 and 100. The 20-day version swings quickly and behaves like a short-term overbought/oversold gauge, the 50-day sits in between, and the 200-day version moves slowly and describes the long-term participation regime.
Diffusion indexes are borrowed machinery: economists have long summarized many yes/no series into a single participation percentage, and breadth analysts applied the same trick to price-versus-average tests. The design's virtue is legibility, every member votes once, the scale is fixed, and readings translate across time, which is why the family became standard dashboard fare wherever member-level data exists.
Because every stock counts equally, the reading exposes what a capitalization-weighted index hides: a benchmark can print new highs while the share of members above their 200-day average quietly erodes. Commonly cited zones treat very high readings as crowded participation and very low readings as washout conditions, but useful thresholds differ by market, era, and lookback, and strong trends can hold elevated readings far longer than reversion traders expect.
The reading rewards being taken as three questions rather than one number: the level (how broad participation is), the direction (whether it is building or eroding), and the disagreement (whether the series confirms what the index is doing). The lookbacks divide the labor, with the 20-day supplying swing extremes, the 200-day supplying regime, and the spread between them a rough rotation read, fast money re-engaging before slow participation repairs, or abandoning ship first while the long base still holds.
How to read a percent-above-MA gauge
The series plots 0 to 100 in its own pane; the reading is level, direction, and confirmation, per lookback.
- 1Fix the universe and lookback: which index's members, and which moving average (20, 50, or 200 days) the percentage tests.
- 2Read the level against zones calibrated to that market's own history rather than borrowed constants.
- 3Read the direction: participation building or eroding often matters more than the absolute level, especially mid-range.
- 4Compare lookbacks: a strong 20-day reading over a weak 200-day one marks a bounce inside a damaged regime; the reverse marks a pullback inside a healthy one.
- 5Check confirmation against the index: the benchmark at highs while the 200-day percentage erodes is the classic participation divergence.
- 6Watch the washout-thrust sequence: single-digit 20-day readings mark capitulation conditions, and the speed of the subsequent expansion grades the recovery.
How it's calculated
The percentage of an index's members closing above their own n-day simple moving average, a breadth reading between 0 and 100.
Also called a diffusion index; 50 means half the universe is above the average.
Always defined against a stated universe such as S&P 500 or NYSE members, so the membership list affects the reading.
The comparison is each stock's close against the SMA of its own closes, usually with strict greater-than.
How traders use it
- As a regime gauge: the 200-day version holding above or below its midpoint frames bull versus bear participation, and erosion in it while the index makes highs is a form of participation divergence.
- As a washout timer: readings near single digits on the 20-day version flag capitulation conditions that mean-reversion traders watch, with the caveat that bear markets can produce several such extremes in sequence.
- As a recovery thrust input: fast expansion from a deep low toward a high reading resembles the logic of breadth thrusts and is read as evidence of broad re-engagement.
- In sector rotation: per-sector diffusion readings show where participation is building or draining, complementing advance/decline internals with a slower, level-based view of each group's health.
- As volatility context: breadth washouts on the fast lookback typically coincide with VIX spikes, and disagreement between the two (panic in one, calm in the other) is itself a reading worth investigating.
Percent-above-MA vs other breadth gauges
Advance/decline Internals: A/D series count each session's winners and losers, a flow measure that accumulates path. The diffusion percentage is a state measure: where each member stands relative to its own average right now, insensitive to how it got there.
McClellan Oscillator: The McClellan family smooths daily A/D differences into momentum readings, fast-reacting and centered on zero. Percent-above-MA is bounded, slower, and level-oriented, which makes it the regime witness while McClellan tools time the swings.
TICK Index: TICK counts upticking versus downticking issues second by second, the intraday extreme of breadth measurement. The diffusion percentages sit at the opposite end, summarizing weeks to months of participation; they share the equal-vote philosophy at incompatible clock speeds.
Concept family
Breadth, Sentiment & External Data
63 concepts mapped · 63 in the Library
% Stocks Above 20/50/200-day MA FAQ
Turn % Stocks Above 20/50/200-day MA into a trading strategy.
Take the implementation from this page into Quant, then build on it, backtest it on real data, and keep refining it in conversation.