Concept
TICK Index
TICK Index, also known as NYSE TICK, cumulative TICK, is a Breadth, Sentiment & External Data concept. The Library holds 1 implementation, a working definition you can pull into Quant.
Top TICK Index indicator
The top custom implementation, built on the original standard TICK Index formula.
1 total
Want to trade TICK Index? The implementation below is one prompt away from a backtested strategy in Quant.
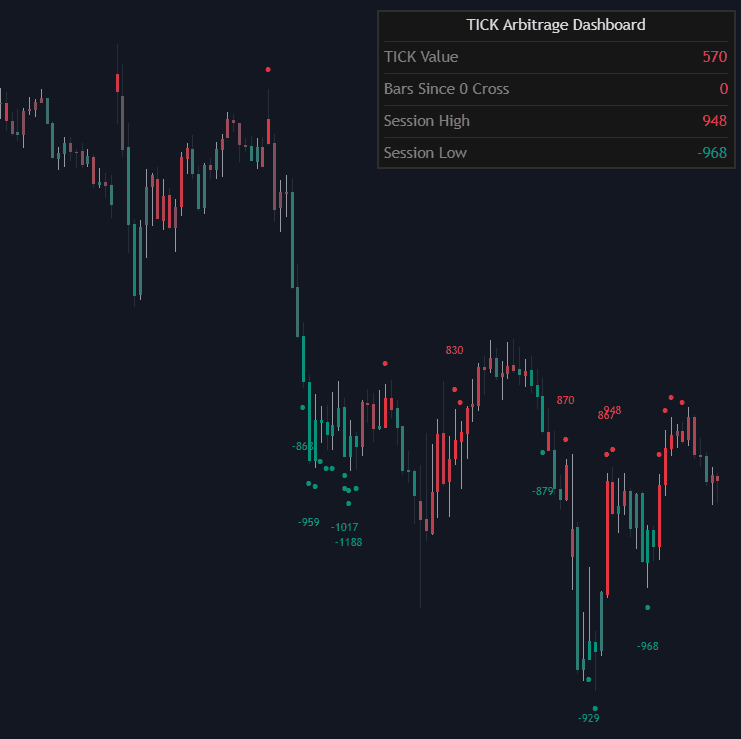
What is the TICK Index?
The TICK index is a real-time market internal: at any moment it equals the number of NYSE stocks whose most recent trade printed on an uptick minus the number whose last trade printed on a downtick (a NASDAQ version, TICKQ, does the same for that exchange). It refreshes continuously through the session and captures instantaneous, marketwide pressure, much of it driven by program and basket orders that hit hundreds of symbols at once. Readings oscillate around zero, most prints sit within a few hundred either side, and moves beyond roughly plus or minus 1,000 are commonly treated as extremes.
TICK is among the oldest intraday internals, a fixture of index-futures day trading since the floor era precisely because it sees what the index quote hides: whether this second's tape is a broad program sweeping hundreds of names or a handful of heavyweights moving the average alone. Its character drifts with market structure, decimalization, algorithmic execution, and changing listing counts have all shifted the distribution of readings over the years, so its thresholds are calibrated rather than carved in stone.
It is strictly a regular-session tool: outside regular trading hours few stocks print, so the reading sits near zero and means little. And because each print is a snapshot rather than a total, day traders also keep a cumulative TICK, a running sum of readings across the session, to see whether pressure is persistently one-sided.
The standard reads split by regime. In balanced conditions, extremes mark short-term crescendos of program activity that mean-revert within minutes, the fade trade; on trend days the same extremes recur all session on one side while the zero line barely gets visited, and the correct read flips from fading prints to respecting the persistence. Cumulative TICK arbitrates: a running sum that trends steadily is the one-sided-day signature, while one oscillating around flat certifies the fade regime.
How to read the TICK index
TICK is read as a distribution and a rhythm, not as isolated prints.
- 1Plot the session's TICK with guide lines near +1,000 and -1,000, then calibrate those extremes against the recent weeks' actual distribution.
- 2Confine the reading to regular hours: outside the cash session the index sits near zero and carries no information.
- 3Watch which side of zero hosts the session: readings spending hours predominantly positive or negative mark a one-sided tape.
- 4Run the cumulative sum alongside: a trending cumulative TICK is the trend-day signature; a flat, oscillating one licenses mean-reversion tactics.
- 5Treat extreme prints by regime: in balance they are fade candidates back toward the mean, on trend days they are confirmation of the drive.
- 6Compare TICK swings at price extremes: a new session high in price on a weaker TICK high suggests the push is running on fewer names.
How it's calculated
The net count of NYSE stocks whose most recent trade was an uptick versus a downtick, updated throughout the trading day.
Stocks whose last trade was unchanged count in neither U_t nor D_t.
The index is computed and published by the exchange (symbols such as $TICK or TICK.NY); parallel versions exist for Nasdaq and other exchanges.
Readings beyond roughly +1000 or -1000 are commonly treated as short-term extremes, and the series is only meaningful during regular trading hours.
How traders use it
- As a fade trigger: in rangebound conditions, mean-reversion day traders fade extreme prints back toward the session average, accepting that on trend days the same extremes simply keep coming.
- As trend-day recognition: TICK holding one side of zero for hours while cumulative TICK trends marks a one-sided session where fading is the wrong playbook; up/down volume gives the volume-weighted second opinion.
- As a divergence read: a new session high in price on weaker TICK highs suggests thinning participation behind the push, a warning to tighten management rather than a standalone signal.
- In a layered internals stack: TICK supplies the second-by-second pulse while advance/decline internals score the day and slower breadth gauges frame the regime, each clock answering a different question.
- For execution timing: scalpers time entries against adverse TICK crescendos, entering longs as a negative extreme exhausts rather than into it, using the internal as a micro-timing aid for decisions made on other grounds.
TICK vs other breadth internals
Advance/decline Internals: A/D counts issues up or down on the day, a slowly drifting session score. TICK counts last prints this second, mean-reverting in minutes. One is the scoreboard, the other the crowd noise, and day traders typically watch both.
McClellan Oscillator: The McClellan oscillator smooths daily advance-decline differences into a multi-day breadth momentum read; it has no intraday existence. TICK lives entirely inside the session. The pair bracket the timescales of breadth analysis.
% Stocks Above 20/50/200-day MA: Diffusion percentages describe participation regimes over weeks and months, updating once a day. TICK updates every second and forgets within minutes. The two share the equal-vote philosophy at opposite ends of the clock.
Concept family
Breadth, Sentiment & External Data
63 concepts mapped · 63 in the Library
TICK Index FAQ
Turn TICK Index into a trading strategy.
Take the implementation from this page into Quant, then build on it, backtest it on real data, and keep refining it in conversation.