Concept
Point & Figure
Point & Figure is a Meta & Composition concept. The Library holds 1 implementation, a working definition you can pull into Quant.
Top Point & Figure indicator
The top custom implementation, built on the original standard Point & Figure formula.
1 total
From studying Point & Figure to trading it: take the implementation below into Quant and backtest it instantly.
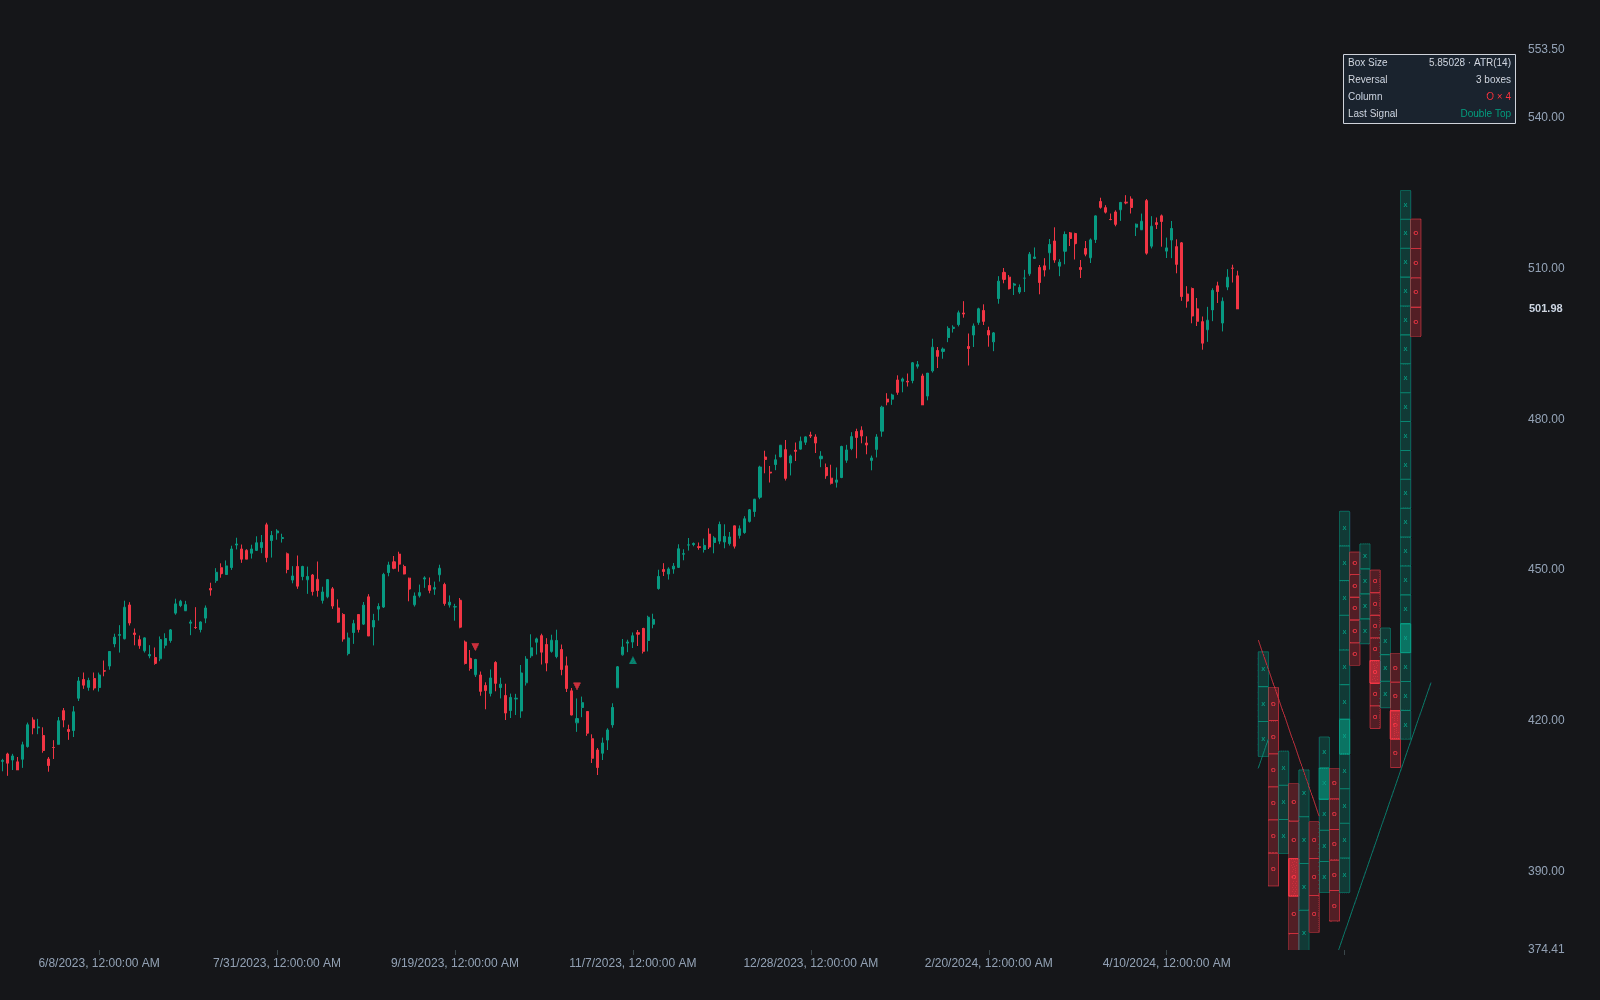
What is Point & Figure?
Point & Figure is a time-independent charting method that records price in alternating columns of X's (rising) and O's (falling). Two settings define the chart. The box size is the minimum move required to add a mark to the current column; the reversal count, classically three boxes, is how far price must retrace before a new column starts in the opposite direction. Moves smaller than a box never print, so a single column can span an hour or a month, and the chart only advances when price actually goes somewhere.
The method is one of the oldest in Western technical analysis, rooted in the figure charts of late-1800s tape readers and codified by Victor de Villiers in the 1930s. Because the reversal filter strips small fluctuations, support and resistance appear as flat rows of column tops and bottoms, and signals are defined mechanically rather than by eye: a double top buy prints when an X column rises one box above the previous X column's high, with mirrored sell logic in O columns. Vertical and horizontal counts project objectives from column length and congestion width, projection logic in the spirit of the measure rule, and like all measured objectives they are estimates, not promises.
The counting methods deserve their own mention because nothing like them exists on bar charts. A vertical count takes an impulse column's length, multiplies by the box size and reversal count, and projects the product from the column's base as an objective; a horizontal count does the same with the width of a congestion zone, on the logic that the size of the cause scales the effect. Three-box charts also carry a unique trendline convention: bullish support and bearish resistance lines drawn at 45 degrees from lows and highs, possible only because the x-axis counts columns rather than time.
Box sizing is where the old method meets modern practice. Fixed boxes suit tick-denominated futures; percentage boxes keep the chart meaningful across large price ranges, the same motivation as logarithmic chart scales; and volatility-scaled boxes adapt the filter to conditions. The framework also composes: LonesomeTheBlue's PnF RSI and PnF Moving Average studies recompute familiar indicators on the box series so they update only on filtered progress, and the method's long-standing role in relative-strength work applies the same columns to ratio series for rotation decisions.
How to read a Point & Figure chart
Everything on the chart follows from two settings and the column logic, so reading it is a short procedure.
- 1Fix the two parameters: box size (fixed, percentage, or volatility-scaled) and reversal count, classically three boxes.
- 2Check the construction source: close-only charts print less and filter more; high/low charts register intrabar extremes.
- 3Read the columns: X's rise, O's fall, and a new column starts only after a reversal-sized retracement from the current column's extreme.
- 4Locate the signals: double and triple tops and bottoms, catapults, and the 45-degree bullish support and bearish resistance lines conventional on three-box charts.
- 5Project the counts: vertical counts from impulse columns and horizontal counts from congestion width give objectives, treated as scenarios rather than promises.
How traders use it
- As a trend filter: the current column's direction is a simple regime read, since a column only flips after a reversal-sized retracement; the 45-degree trendlines conventional on three-box charts extend the same idea across columns.
- As a mechanical signal set: double and triple top and bottom breakouts give unambiguous, backtestable entries, because a box either printed or it did not.
- As a noise filter for other tools: familiar oscillators and averages can be recomputed on the box series instead of raw bars, inheriting the reversal filter so they update only when price makes filtered progress.
- For relative strength: running the columns on a ratio of two instruments, an application of cross-instrument composition, turns rotation decisions into mechanical column reads, a long-standing institutional practice.
- As an alert framework: because box prints and column flips are discrete events, they map cleanly onto alerts and webhooks, letting a chart that ignores time notify you the moment filtered price actually does something.
Point & Figure vs related chart transforms
Renko: Both discard time, but Renko prints uniform bricks one move at a time and typically needs a two-brick move to reverse. Point & Figure stacks boxes into columns, separates box size from reversal count, and carries a signal vocabulary (double tops, counts, 45-degree lines) that Renko lacks.
Alternative Bar Types: Tick, volume, and range bars change when a bar closes but still draw ordinary OHLC bars, so standard tools carry over. Point & Figure abandons bar anatomy altogether; only filtered directional movement remains.
Heikin Ashi: Heikin Ashi smooths by averaging bar components but keeps the time axis and bar form, so it softens noise while preserving the familiar chart. Point & Figure removes noise by refusing to print it, and removes time entirely; the two denoise by fundamentally different contracts.
Concept family
Meta & Composition
28 concepts mapped · 28 in the Library
Point & Figure FAQ
Turn Point & Figure into a trading strategy.
Take the implementation from this page into Quant, then build on it, backtest it on real data, and keep refining it in conversation.